![[Previous]](prev.gif) |
![[Contents]](contents.gif) |
![[Index]](keyword_index.gif) |
![[Next]](next.gif) |
![[Previous]](prev.gif) |
![[Contents]](contents.gif) |
![[Index]](keyword_index.gif) |
![[Next]](next.gif) |
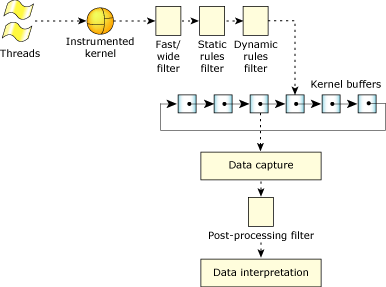
Because the amount of data the Instrumented Kernel generates can be overwhelming, the SAT includes several filters to reduce the amount of data to be processed. The filters can be customized to perform complex decision-making before filtering and other tasks.
The following filters are available:
Except for the post-processing facility, all the filters affect the amount of data being logged into the kernel buffers. Unlike the other filters, the post-processing facility doesn't discard data; it simply doesn't use it. If the data is stored, it can always be used later.

Overall view of the SAT and its filters.
There are trade-offs to consider when filtering:
The fast/wide mask affects whether data is gathered in fast mode or wide mode. The fast/wide settings can be made on a per-event class and type basis—some can be fast while others are wide.
In wide mode, the entire event is stored, using as many buffer slots as required. In fast mode, each event is stored as a single buffer slot—“multiple buffer slot events” (combine events) are simplified down to a single buffer slot.
In general, wide mode will generate several times more data than fast mode.
 |
The fast/wide filter doesn't clip the tail end of “multiple buffer slot events” (combine events); it summarizes the most important aspects of the event in a single buffer slot. Thus, the first element of a “multiple buffer slot event” (combine event) may not be the same in fast and wide mode. (The fast/wide filter isn't a mask.) |
You can set the filter with the TraceEvent() function:
TraceEvent (
   _NTO_TRACE_SETALLCLASSESWIDE ); /* wide mode */
TraceEvent (
   _NTO_TRACE_SETALLCLASSESFAST ); /* fast mode */
For more information about TraceEvent(), see the Neutrino Library Reference. For an example of using fast or wide mode, see the all_classes.c example in the Tutorial chapter.
For the specific output differences between fast and wide mode, see the Kernel Call Arguments and Return Values appendix.
The static rules filter uses pre-defined classes and types defined in TraceEvent() that may be modified “on the fly” using a custom program.
The static rules filter is the best, most efficient method of data reduction. Because it's a fast filter, severe filtering will generally free up the processor while reducing the data rate to a comparative trickle. The filter is also useful for gathering large amounts of data periodically, or after many hours of logging without generating gigabytes of data in the interim.
Set the filter using the TraceEvent() function:
TraceEvent (
   _NTO_TRACE_ADDCLASS,
   _NTO_TRACE_INTENTER );
TraceEvent (
   _NTO_TRACE_SETCLASSPID,
   _NTO_TRACE_KERCALL,
   pid ); /* "pid" is pid number */
TraceEvent (
   _NTO_TRACE_SETCLASSTID,
   _NTO_TRACEPROCESS,
   pid,
   tid ); /* "tid" is tid number */
TraceEvent (
   _NTO_TRACE_ADDEVENT,
   _NTO_TRACE_THREAD,
   _NTO_TRACE_THRUNNING );
For an example using the static filter, see the five_events.c example in the Tutorial chapter.
The dynamic rules filter can do all the filtering that the static filter does, and more, but it isn't as fast.
The dynamic rules filter can be “turned on” with _NTO_TRACE_ADDEVENTHANDLER and _NTO_TRACE_ADDCLASSEVHANDLER modes. Using these modes, the user can attach its own custom defined function (event handler) that will control emission of trace events.
The dynamic filter is an event handler that works like an interrupt handler. When this filter is used, a section of your custom code is executed. The code can test for a set of conditions before determining whether the event should be stored. The code must return 0 to prevent the event from being stored. On any return except zero, the event is stored.
For example, a dynamic control of one particular event from one particular class can be performed using _NTO_TRACE_ADDEVENTHANDLER interface mode as:
TraceEvent(_NTO_TRACE_ADDEVENTHANDLER,
           class,
           event,
           int (*event_hdlr)(event_data_t*),
           event_data_t* data_struct)
A permanent “ON” state of the filter can be achieved with a very simple event handler defined as:
int event_handler(event_data_t* dummy_pt)
{
 return(1);
}
In addition to deciding whether or not the event should be logged, the dynamic rules filter can be used to output events to external hardware or to perform other tasks— it's up to you because it's your code. Naturally, you should write the code as efficiently as possible in order to minimize the overhead.
It is possible to access the information about the intercepted event within the event handler. This can be done by examining members of even_data_t structure passed as an argument to the event handler. You can find a more detailed description of the event_data_t members in “Dynamic rules filter configuration” in the entry for TraceEvent() in the Neutrino Library Reference.
For example of using the dynamic filter, see the eh_simple.c example in the Tutorial chapter.
The post-processing facility is different from the other filters in that it reacts to the events without permanently discarding them (or having to choose not to). Because the processing would be done on the captured data, often saved as a file, you could make multiple passes on the same data without changing it—one pass could count the number of thread state changes, another pass could display all the kernel events.
The post-processing facility is really a collection of callback functions that decide what to do for each event.
For an example of a post-processing facility, see the source code for traceprinter.
![[Previous]](prev.gif) |
![[Contents]](contents.gif) |
![[Index]](keyword_index.gif) |
![[Next]](next.gif) |