![[Previous]](prev.gif) |
![[Contents]](contents.gif) |
![[Index]](keyword_index.gif) |
![[Next]](next.gif) |
|
|
|
|
A bar graph
PtWidget → PtBasic → PtBarGraph
For more information, see the diagram of the widget hierarchy.
<photon/PtBarGraph.h>
PtBarGraph draws a horizontal or vertical bar graph, with or without a grid.
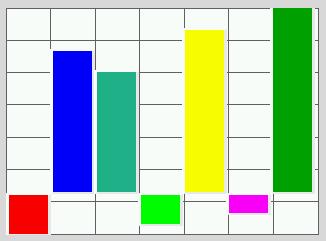
A PtBarGraph widget.
You specify the bars by setting Pt_ARG_BARGRAPH_DATA to an array of values. The colors of the bars depends on how you set the widget's resources:
The Pt_ARG_BARGRAPH_FLAGS resource controls the direction of the graph and whether or not the grid is displayed.
If you set Pt_ARG_BARGRAPH_DEPTH to a positive value, the bars are drawn with a bevel.
| Resource | C type | Pt type | Default |
|---|---|---|---|
| Pt_ARG_BARGRAPH_BASE | short | Scalar | 0 |
| Pt_ARG_BARGRAPH_COLOR | PgColor_t, short | Array | NULL |
| Pt_ARG_BARGRAPH_DATA | short, short | Array | NULL |
| Pt_ARG_BARGRAPH_DEPTH | short | Scalar | 0 |
| Pt_ARG_BARGRAPH_FLAGS | long | Flag | Pt_BARGRAPH_VERTICAL |
| Pt_ARG_BARGRAPH_GRID_COLOR | PgColor_t | Scalar | Pg_DGREY |
| Pt_ARG_BARGRAPH_GRID_HORIZ | short | Scalar | 6 |
| Pt_ARG_BARGRAPH_GRID_VERT | short | Scalar | 6 |
| Pt_ARG_BARGRAPH_MAX | short | Scalar | SHRT_MAX |
| Pt_ARG_BARGRAPH_MIN | short | Scalar | SHRT_MIN |
| C type | Pt type | Default |
|---|---|---|
| short | Scalar | 0 |
The value that's used as the base line for the bars. If the data for a bar is greater than this value, the bar is displayed above the base line (for a vertical bar graph) or to the right (for a horizontal graph).
| C type | Pt type | Default |
|---|---|---|
| PgColor_t, short | Array | NULL |
An array of colors to use for the bars. If this resource is NULL, the widget uses the value of Pt_ARG_COLOR (inherited from PtBasic) as the color for all the bars.
You should have at least as many bar colors as entries in the Pt_ARG_BARGRAPH_DATA array.
 |
You can't edit this resource in PhAB. |
Here's an example of setting this resource:
PgColor_t   bar_colours[7] = {Pg_RED, Pg_BLUE, Pg_CELIDON,
                              Pg_GREEN, Pg_YELLOW, Pg_MAGENTA,
                              Pg_DGREEN };

PtSetResource (widget, Pt_ARG_BARGRAPH_COLOR, bar_colours, 7);
| C type | Pt type | Default |
|---|---|---|
| short, short | Array | NULL |
The data to be displayed in the bar graph. When you set this resource, the value is the array of data, and arg is the number of bars.
|
You can't edit this resource in PhAB. |
Here's an example of setting this resource:
short bar_values[7] = {0, 450, 399, 22, 500, 50, 555 };

PtSetResource (widget, Pt_ARG_BARGRAPH_DATA, bar_values, 7);
| C type | Pt type | Default |
|---|---|---|
| short | Scalar | 0 |
The depth of the bars in the graph, in pixels.
| C type | Pt type | Default |
|---|---|---|
| long | Flag | Pt_BARGRAPH_VERTICAL |
Flags that affect the appearance and behavior of the bar graph; a combination of:
| C type | Pt type | Default |
|---|---|---|
| PgColor_t | Scalar | Pg_DGREY |
The color of the grid, if displayed.
|
You can't edit this resource in PhAB. |
| C type | Pt type | Default |
|---|---|---|
| short | Scalar | 6 |
The number of horizontal lines in the grid.
| C type | Pt type | Default |
|---|---|---|
| short | Scalar | 6 |
The number of vertical lines in the grid.
| C type | Pt type | Default |
|---|---|---|
| short | Scalar | SHRT_MAX |
The maximum value in the bar graph.
| C type | Pt type | Default |
|---|---|---|
| short | Scalar | SHRT_MIN |
The minimum value in the bar graph.
If the widget modifies an inherited resource, the “Default override” column indicates the new value. This modification affects any subclasses of the widget.
|
|
|
|