![[Previous]](prev.gif) |
![[Contents]](contents.gif) |
![[Index]](keyword_index.gif) |
![[Next]](next.gif) |
![[Previous]](prev.gif) |
![[Contents]](contents.gif) |
![[Index]](keyword_index.gif) |
![[Next]](next.gif) |
In this chapter:
Have you ever had a customer say, “The program was working fine for days, then it just crashed”? If so, chances are good that your program had a memory error — somewhere.
Debugging memory errors can be frustrating; by the time a problem appears, often by crashing your program, the corruption may already be widespread, making the source of the problem difficult to trace.
Memory analysis is a key function to ensuring the quality of your systems. The QNX Memory Analysis perspective shows you how your program uses memory, and can help ensure that your program won't cause problems. The perspective helps you quickly pinpoint memory errors in your development and testing environments before your customers get your product.
 |
The QNX Memory Analysis perspective may produce incorrect results when more than one IDE is communicating with the same target system. To use this perspective, make sure that only one IDE is connected to the target system. |
By design, Neutrino's architecture helps ensure that faults, including memory errors, are confined to the program that caused them. Programs are less likely to cause a cascade of faults because processes are isolated from each other and from the microkernel. Even device drivers behave like regular debuggable processes:
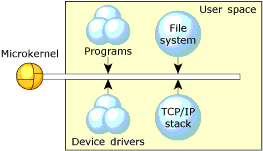
The microkernel architecture.
This robust architecture ensures that crashing one program has little or no effect on other programs throughout the system. If a program faults, you can be sure that the error is restricted to that process's operation.
Neutrino's full memory protection means that almost all the memory addresses your program encounters are virtual addresses. The process manager maps your program's virtual memory addresses to the actual physical memory; memory that is contiguous in your program may be transparently split up in your system's physical memory:
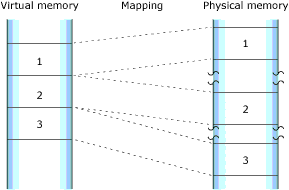
How the process manager allocates memory into pages.
The process manager allocates memory in small pages (typically 4 KB each). To determine the size for your system, use the sysconf(_SC_PAGESIZE) function.
As you'll see when you use the Memory Information view of the QNX System Information perspective, the IDE categorizes your program's virtual address space as follows:
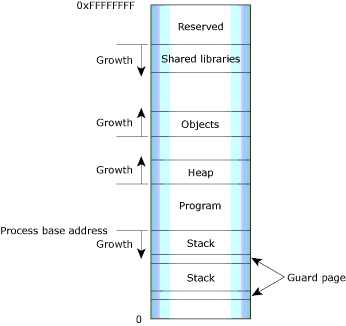
Process memory layout on an x86.
The Memory Information and Malloc Information views of the QNX System Information perspective provide detailed, live views of a process's memory. For more information, see the Getting System Information chapter.
Program memory holds the executable contents of your program. The code section contains the read-only execution instructions (i.e. your actual compiled code); the data section contains all the values of the global and static variables used during your program's lifetime:
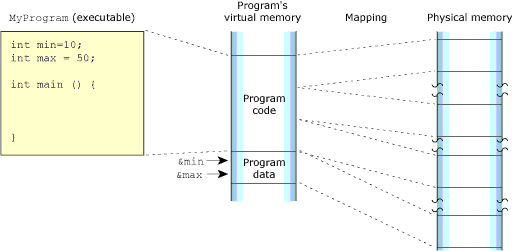
The program memory.
Stack memory holds the local variables and parameters your program's functions use. Each process in Neutrino contains at least the main thread; each of the process's threads has an associated stack. When the program creates a new thread, the program can either allocate the stack and pass it into the thread-creation call, or let the system allocate a default stack size and address:

The stack memory.
When your program runs, the process manager reserves the full stack in virtual memory, but not in physical memory. Instead, the process manager requests additional blocks of physical memory only when your program actually needs more stack memory. As one function calls another, the state of the calling function is pushed onto the stack. When the function returns, the local variables and parameters are popped off the stack.
The used portion of the stack holds your thread's state information and takes up physical memory. The unused portion of the stack is initially allocated in virtual address space, but not physical memory:
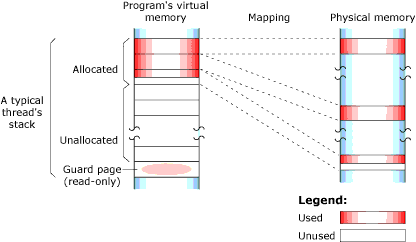
Stack memory: virtual and physical.
At the end of each virtual stack is a guard page that the microkernel uses to detect stack overflows. If your program writes to an address within the guard page, the microkernel detects the error and sends the process a SIGSEGV signal.
As with other types of memory, the stack memory appears to be contiguous in virtual process memory, but isn't necessarily so in physical memory.
Shared-library memory stores the libraries you require for your process. Like program memory, library memory consists of both code and data sections. In the case of shared libraries, all the processes map to the same physical location for the code section and to unique locations for the data section:
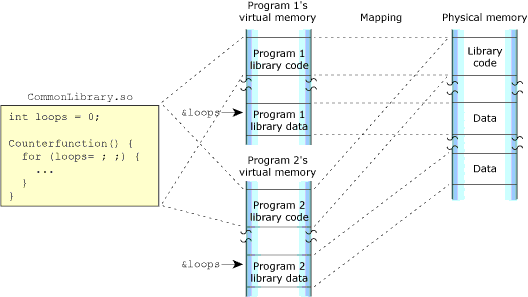
The shared library memory.
Object memory represents the areas that map into a program's virtual memory space, but this memory may be associated with a physical device. For example, the graphics driver may map the video card's memory to an area of the program's address space:

The object memory.
Heap memory represents the dynamic memory used by programs at runtime. Typically, processes allocate this memory using the malloc(), realloc(), and free() functions. These calls ultimately rely on the mmap() function to reserve memory that the malloc library distributes.
The process manager usually allocates memory in 4 KB blocks, but allocations are typically much smaller. Since it would be wasteful to use 4 KB of physical memory when your program wants only 17 bytes, the malloc library manages the heap. The library dispenses the paged memory in smaller chunks and keeps track of the allocated and unused portions of the page:
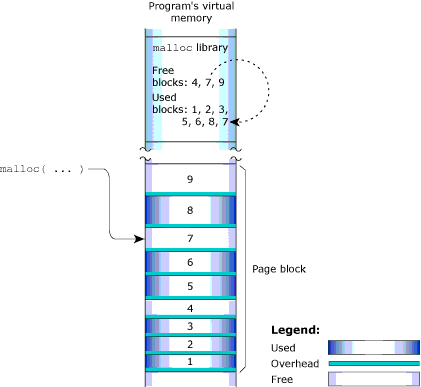
The heap memory
Each allocation uses a small amount of fixed overhead to store internal data structures. Since there's a fixed overhead with respect to block size, the ratio of allocator overhead to data payload is larger for smaller allocation requests.
When your program uses the malloc() function to request a block of memory, the malloc library returns the address of an appropriately sized block. To maintain constant-time allocations, the malloc library may break some memory into fixed blocks. For example, the library may return a 20-byte block to fulfill a request for 17 bytes, a 1088-byte block for a 1088-byte request, and so on.
When the malloc library receives an allocation request that it can't meet with its existing heap, the library requests additional physical memory from the process manager. These allocations are done in chunks called “arenas”. By default, the arena allocations are performed in 32 KB chunks. The value must be a multiple of 4 KB, and currently is limited to less than 256 KB. When memory is freed, the library merges adjacent free blocks within arenas and may, when appropriate, release an arena back to the system.
For detailed information about arenas, see “Arena allocations” in the QNX Neutrino System Architecture guide.
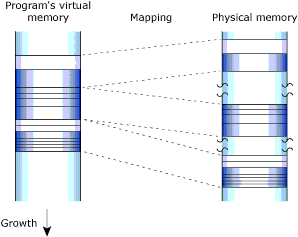
How virtual memory is mapped to physical memory.
For more information about the heap, see “Heap corruption” in the QNX Neutrino System Architecture guide.
Typically, virtual memory occupied by a process can be separated into the following categories:
 |
It is important to know how much memory each individual process uses, otherwise you can spend considerable time trying to optimize the heap (i.e., if a process uses only 5% of the total process memory, is it unlikely to return any noticeable result). Techniques for optimizing a particular type of memory are also dramatically different. |
For information about obtaining process memory distribution details, see “Inspecting your process memory distribution.”
The main system allocator has been instrumented to keep track of statistics associated with allocating and freeing memory. This lets the memory statistics module unobtrusively inspect any process's memory usage.
When you launch your program with the Memory Analysis tool, your program uses the debug version of the malloc library (libmalloc_g.so). Besides the normal statistics, this library also tracks the history of every allocation and deallocation, and provides cover functions for the string and memory functions (e.g. strcmp(), memcpy(), memmove()). Each cover function validates the corresponding function's arguments before using them. For example, if you allocate 16 bytes, then forget the terminating NULL character and attempt to copy a 16-byte string into the block using the strcpy() function, the library detects the error.
The debug version of the malloc library uses more memory than the nondebug version. When tracing all calls to malloc() and free(), the library requires additional CPU overhead to process and store the memory-trace events.
 |
Be sure to occasionally check the Downloads area on our website for updated versions of the debug malloc library. |
The QNX Memory Analysis perspective can help you pinpoint and solve various kinds of problems, including:
A memory leak is a portion of heap memory that was allocated but not freed, and the reference to that area of memory cannot be used by the application any longer. Typically, the elimination of a memory leak is critical for applications that run continuously because even a single byte leak can crash a mission critical application that runs over time.
Memory leaks can occur if your program allocates memory and then forgets to free it later. Over time, your program consumes more memory than it actually needs.
In its mildest form, a memory leak means that your program uses more memory than it should. QNX Neutrino keeps track of the exact memory your program uses, so once your program terminates, the system recovers all the memory, including the lost memory.
If your program has a severe leak, or leaks slowly but never terminates, it could consume all memory, perhaps even causing certain system services to fail.
The following tabs in the Memory Analysis editor can help you find and fix memory leaks:
For more information about the memory analysis editor, see Viewing memory analysis data (memory analysis editor) later in this chapter. For detailed descriptions about memory errors, see “Interpreting errors during memory analysis”. For more information about the heap, see Dynamic memory management.
Memory errors can occur if your program tries to free the same memory twice or uses a stale or invalid pointer. These “silent” errors can cause surprising, random application crashes. The source of the error can be extremely difficult to find, because the incorrect operation could have happened in a different section of code long before an innocent operation triggered a crash. For more information about how to interpret memory errors during memory analysis, see the topic “Interpreting errors during memory analysis” later in this chapter.
In the event of a memory error, the IDE can:
The resulting action that the IDE takes depends on the setting that you choose in the Memory Analysis Tool area of the launch configuration (see “Launching your program with Memory Analysis,” later in this chapter).
The Memory Analysis editor's Errors and Statistics tabs show memory errors and — if possible — the exact line of source code that generated each error. The Trace tab lets you find the prior call that accessed the same memory address, even if your program made the call days earlier. For more information about the memory analysis editor, see Viewing memory analysis data (memory analysis editor) later in this chapter. For detailed descriptions about memory errors, see “Interpreting errors during memory analysis”.
 |
To learn more about the common causes of memory problems, see the topic Heap Analysis: Making Memory Errors a Thing of the Past chapter of the QNX Neutrino Programmer's Guide. |
To extract the most information from your program, you should launch it with the Memory Analysis tool enabled:
 |
If your binary is instrumented with Mudflap, you can't run Memory Analysis on it because there will be a conflict (trying to overload the same functions), and it will cause the program to crash. |
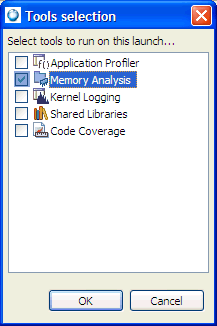
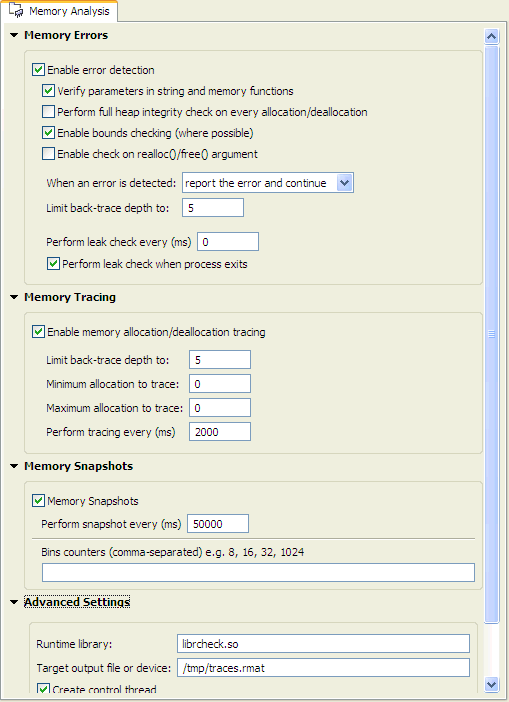
This group of configuration options controls the Memory Analysis tool's behavior when memory errors are detected.
When enabled, check the parameters in calls to str*() and mem*() functions for sanity.
When enabled, check the heap's memory chains for consistency before every allocation or deallocation. Note that this checking comes with a performance penalty.
When enabled, check for buffer overruns and underruns. Note that this is possible only for dynamically allocated buffers.
This group of configuration options controls the Memory Analysis tool's memory tracing features.
Controls the Memory Analysis tool's memory snapshot feature.
A list of the libraries that you want to have backtrace information for.
These settings let you specify details about how memory debugging will be handled on the target system.
The full path to the device that will receive trace messages. The default is /dev/dbgmem. You can also log traces to a file on the target; for more information, see “Using a file to log the trace,” later in this chapter.
The full path to the device that will receive memory events. The default is /dev/dbgmem.
Enable this to use a separate thread for memory tracing operations.
For example, if you attach the Memory Analysis tool to a program that uses fork, it creates a second thread; however, fork only works with single threaded programs. Consequently, you must disable the control thread of the Memory Analysis tool (from the Launch Configuration, select and disable Create control thread.)
For information about debugging with fork(), see “Debugging a child process.”
Provide backtrace information from shared objects that were built with debugging information.
 |
This option is not available for the newer library file librcheck.so; however, it is available for the older file libmalloc_g.so. The availability of this option depends on which library was specified as a Runtime library. |
Enable this to show messages from the memory-debugging library in the Console view.
 |
Don't run more than one Memory Analysis session on a given target at a time, because the results may not be accurate. |
You can perform memory analysis on a running program, if that program was started using the debug malloc library and the proper environment variables. Once the program is running, you can attach the Memory Analysis perspective and gather your data.
For more information, see “Attaching to a running process” in this chapter.
 |
If a program uses fork, the control thread of the Memory Analysis tool must be disabled. fork works only with single threaded programs. To disable the control thread option for memory analysis:
For information about the Create control thread option, see “Launching your program with Memory Analysis” in this chapter. |
Although the QNX Memory Analysis perspective shows you how your program uses memory, and can quickly direct you to memory errors in your development and testing environments, you need to understand the types of memory errors that you might run into.
During memory analysis, you may encounter the following types of memory errors:
When memory errors occur, the IDE can:
To enable memory analysis:
After you configure the IDE for memory analysis, you can begin to use the results to identify the types of memory errors in your programs, and then trace them back to your code.
To view the memory errors identified by the IDE:
A dialog with the same name as your application will contain a list of memory errors that the IDE encountered in your program.
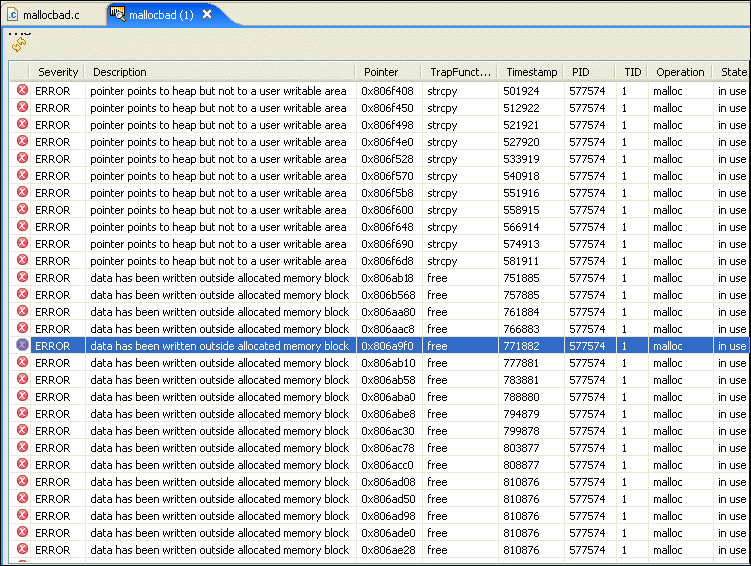

The illegal deallocation of memory occurs when a free() operation is performed on a pointer that doesn't point to an appropriate heap memory segment. This type of error can occur when you attempt to do any of the following activities:
The illegal deallocation of memory can generate the following runtime errors:
In the QNX IDE, the Memory Analysis tool detects this error (if error detection is enabled), and it traps the illegal deallocation error when any of the following functions are called:
 |
For instructions about enabling error detection in the IDE, see “Enabling error detection for the illegal deallocation of memory”. |
To enable error detection for the illegal deallocation of memory:
In the IDE, you can expect the message for this type of memory error to include the following types of information and detail:
For a list of error messages returned by the Memory Analysis tool, see “Error message summary (memory analysis)”.
To help address this memory problem, try the following:
The following code shows an example of the illegal deallocation of memory:
int main(int argc, char ** argv){
  char * str = "";
  if (argc>1) {
     str = malloc(10);
     // ...
  }
  printf("Str: %s\n",str);
  free(str);
  return 0;
}
A NULL pointer dereference is a sub type of an error causing a segmentation fault. It occurs when a program attempts to read or write to memory with a NULL pointer.
Running a program that contains a NULL pointer dereference generates an immediate segmentation fault error.
 |
For instructions about enabling error detection in the IDE, see “Enabling error detection for a NULL pointer dereference”. |
When the memory analysis feature detects this type of error, it traps these errors for any of the following functions (if error detection is enabled) when they are called within your program:
strcat()
strdup()
strncat()
strcmp()
strncmp()
strcpy()
strncpy()
strlen()
strchr()
strrchr()
index()
rindex()
strpbrk()
strspn() (only the first argument)
strcspn()
strstr()
strtok()
The memory analysis feature doesn't trap errors for the following functions when they are called:
memccpy()
memchrv()
memmove()
memcpy()
memcmp()
memset()
bcopy()
bzero()
memccpy()
memchrv()
memmove()
memcpy()
memcmp()
memset()
bcopy()
bzero()
bcmp()
bcmp()
To enable error detection for the NULL pointer dereference:
In the IDE, you can expect the message for this type of memory error to include the following types of information and detail:
For a list of error messages returned by the Memory Analysis tool, see “Error message summary (memory analysis)”.
You can perform an explicit check for NULL for all pointers returned by functions that can return NULL, and when parameters are passed to the function.
The following code shows an example of a NULL pointer dereference:
int main(int argc, char ** argv){
  char buf[255];
  char * ptr = NULL;
  if (argc>1) {
    ptr = argv[1];
  }
  strcpy(str,ptr);
  return 0;
}
A buffer overflow error occurs when a program unintentionally writes to a memory area that's out of bounds for the buffer it intended to write to.
A buffer overflow generates the following runtime errors:
The Memory Analysis tool can detect a limited number of possible buffer overflows with following conditions:
strcat()
strdup()
strncat()
strcmp()
strncmp()
strcpy()
strncpy()
strlen()
strchr()
strrchr()
index()
rindex()
strpbrk()
strspn()
strcspn()
strstr()
strtok()
memccpy()
memchr()
memmove()
memcpy()
memcmp()
memset()
bcopy()
bzero()
bcmp()
To enable error detection for a buffer overflow or underflow:
In the IDE, you can expect the message for this type of memory error to include the following types of information and detail:
For a list of error messages returned by the Memory Analysis tool, see “Error message summary (memory analysis)”.
Locate the code where the actual overflow occurred. Ensure that the size of the memory region is always accompanied by the pointer itself, verify all unsafe operations, and that the memory region is large enough to accommodate the data going into that location.
The following code shows an example of a buffer overflow trapped by a library function:
int main(int argc, char ** argv){
  char * ptr = NULL;
  ptr = malloc(12);
  strcpy(ptr,"Hello World!");
  return 0;
}
The following code shows an example of a buffer overflow trapped by a post-heap check in a free() function:
int main(int argc, char ** argv){
  char * ptr = NULL;
  ptr = malloc(12);
  ptr[12]=0;
  free(pre);
  return 0;
}
If you attempt to read or write to memory that was previously freed, the result will be a conflict and the program will generate a memory error. For example, if a program calls the free() function for a particular block and then continues to use that block, it will create a reuse problem when a malloc() call is made.
Using freed memory generates the following runtime errors:
The Memory Analysis tool can detect only a limited number of situations where free memory is read/written with following conditions:
strcat()
strdup()
strncat()
strcmp()
strncmp()
strcpy()
strncpy()
strlen()
strchr()
strrchr()
index()
rindex()
strpbrk()
strspn()
strcspn()
strstr()
strtok()
memccpy()
memchr()
memmove()
memcpy()
memcmp()
memset()
bcopy()
bzero()
bcmp()
malloc()
calloc()
realloc()
free()
To enable error detection when using freed memory:
In the IDE, you can expect the message for this type of memory error to include the following types of information and detail:
For a list of error messages returned by the Memory Analysis tool, see “Error message summary (memory analysis)”.
Set the pointer of the freed memory to NULL immediately after the call to free(), unless it is a local variable that goes out of the scope in the next line of the program.
The following code shows an example using already freed memory:
int main(int argc, char ** argv){
  char * ptr = NULL;
  ptr = malloc(13);
  free(ptr);
  strcpy(ptr,"Hello World!");
  return 0;
}
If you attempt to read or write to memory that was previously freed, the result will be a conflict and the program will generate a memory error because the memory is not initialized.
Using an uninitialized memory read generates a random data read runtime error.
Typically, the IDE does not detect this type of error; however, the Memory Analysis tool does trap the condition of reading uninitialized data from a recently allocated memory region.
For a list of error messages returned by the Memory Analysis tool, see “Error message summary (memory analysis)”.
Use the calloc() function, which always initializes data with zeros (0).
The following code shows an example of an uninitialized memory read:
int main(int argc, char ** argv){
  char * ptr = NULL;
  ptr = malloc(13);
  if (argc>1)
     strcpy(ptr,"Hello World!");
  ptr[12]=0;
  printf("%s\n",ptr);
  return 0;
}
Memory leaks can occur if your program allocates memory and then does not free it. For example, a resource leak can occur in a memory region that no longer has references from a process.
Resource leaks generate the following runtime errors:
This error would be trapped during the following circumstances:
In the IDE, you can expect the message for this type of memory error to include the following types of information and detail:
In the IDE, you can expect the message for this type of memory error to include the following types of information and detail:
For a list of error messages returned by the Memory Analysis tool, see “Error message summary (memory analysis)”.
To address resource leaks in your program, ensure that memory is deallocated on all paths, including error paths.
The following code shows an example of a memory leak:
int main(int argc, char ** argv){
  char * str = malloc(10);
  if (argc>1) {
     str = malloc(20);
     // ...
  }
  printf("Str: %s\n",str);
  free(str);
  return 0;
}
During memory analysis, the following functions are checked for memory errors:
strcat()
strdup()
strncat()
strcmp()
strncmp()
strcpy()
strncpy()
strlen()
strchr()
strrchr()
index()
rindex()
strpbrk()
strspn()
strcspn()
strstr()
strtok()
memccpy()
memchr()
memmove()
memcpy()
memcmp()
memset()
bcopy()
bzero()
bcmp()
malloc()
calloc()
realloc()
free()
The Session view lets you manage your memory analysis sessions. You can load these sessions into the Memory Analysis perspective, so you can search for memory management errors in your application.
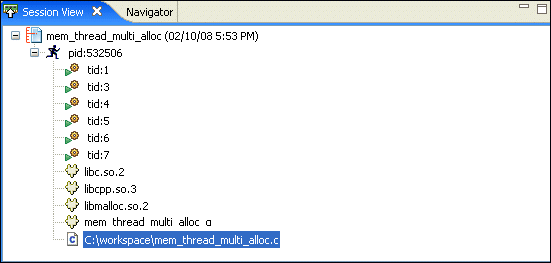
The view lists all of the memory analysis sessions that you've created in your workspace while running programs with the Memory Analysis tool active. Each session is identified by a name, date stamp, and an icon that indicates its current state.
The icons indicate:
 |
If the session is running, you may need to close and reopen the tabs at the top of the editor periodically to refresh the information in the Errors and Statistics panes. |
Right-clicking on a connected session
(![]() )
shows a menu with several options:
)
shows a menu with several options:
Right-clicking on a disconnected session
(![]() )
shows a menu with several options:
)
shows a menu with several options:
Memory Analysis sessions must be “connected” before they can be viewed in the Memory Analysis editor.
To connect to a session:
After a moment, the session is connected
(![]() ).
).
 |
You can also double-click on the session in the Session view to connect to it. |
To delete a session:
The IDE deletes the memory analysis session.
To disconnect a session and recover the resources it uses while connected:
After a moment, the session is disconnected
(![]() ).
).
You'll use this option to export your trace data session information from a Memory Analysis session view. When exporting memory analysis information, the IDE lets you export the event-specific results in .csv format, and the other session trace data in .xml format. Later, you can import the event-specific results into a spreadsheet, or you can choose to import the other session trace data into a Memory Analysis session view.
For more information about exporting session information in CSV or XML format, see “Exporting memory analysis data”.
Occasionally, there may be too much information in a Memory Analysis session, and you might want to filter some of this information to narrow down your search for memory errors, events, and traces.
To filter out Memory Analysis session information:
You can import trace data session information from a Memory Analysis session view. When importing memory analysis session information, the IDE lets you import the event-specific results for libmalloc events in .csv format, and the other session trace data in .xml format. You'll use this item after you've logged trace events to a file on the target system and copied the file to your host system.
For more information about importing memory analysis event data or XML data see “Importing memory analysis data”.
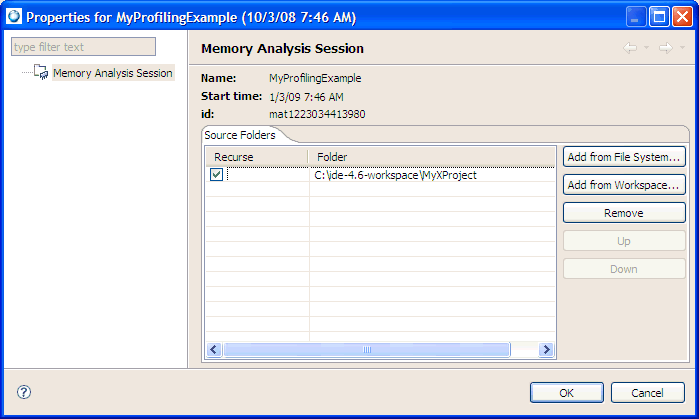
To view information about a session:
The IDE shows a Properties dialog for that memory analysis session:
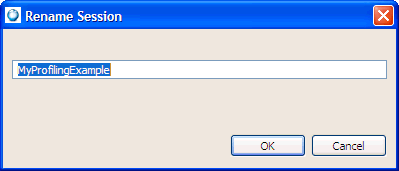
To rename a memory analysis session:
The IDE shows the Rename Session dialog.
The IDE opens the memory analysis session in the Memory Analysis editor.
When you view a connected Memory Analysis session, the Memory Analysis perspective opens that session in the main editor area of the IDE:
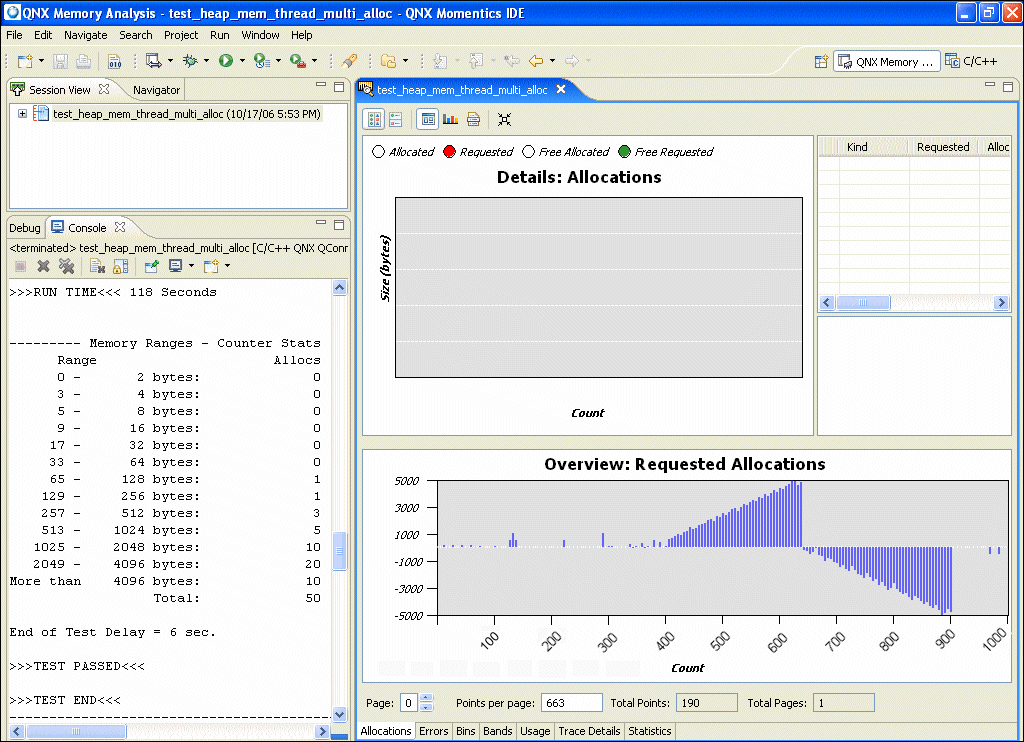
The top half of the window shows details for the data that is selected in the bottom half. The bottom half shows an overview of the entire memory analysis session data set:
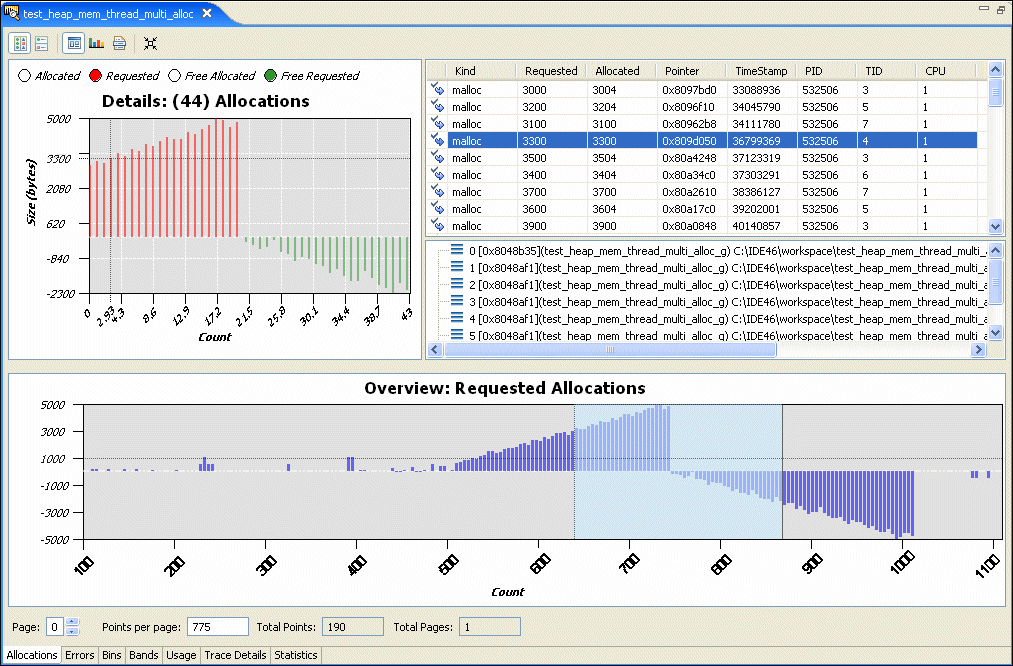
The details include a table of information about the allocations. If you select an allocation, a vertical line indicates its position in the Details chart, and the backtrace (if available) is shown below the table. If you click on a backtrace, the editor shows the associated source code (if available) in another tab.
The icons in the table indicate the type of allocation or deallocation:
The Allocations Overview can be very wide, so it could be divided into pages. You can use the Page field to move from one page to another, and you can specify the number of points to show on each page.
 |
If the process does many allocations and deallocations, it could take some time for the traces and events to be registered, indexed, and shown. |
The tabs at the bottom let you switch between several different data views:
The Memory Analysis perspective updates the details to reflect the data region you've selected.
The Memory Analysis editor has several icons that you can use to control the view:
| Use this icon: | To: |
|---|---|
| Set the Chart and Detail Pane to a horizontal layout, one beside the other | |
| Set the Chart and Detail Pane to a vertical layout, one above the other | |
| Shows the Detail Pane if it's currently hidden | |
| Hide the Detail Pane so the Chart pane has more display room | |
| Hide the Chart pane so the Detail Pane has more display room | |
| Toggle the Overview pane on and off |
Right-click on the Overview pane to change the view options.
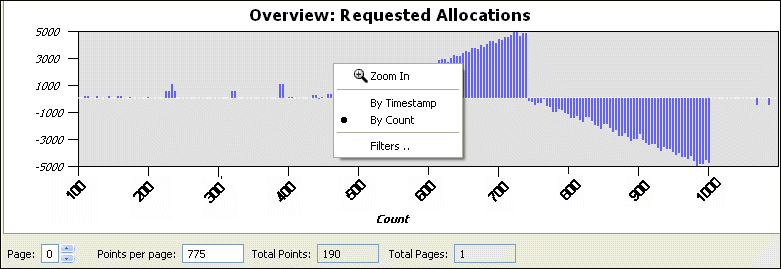
This menu includes:
You can control the Detail pane through its context menu:
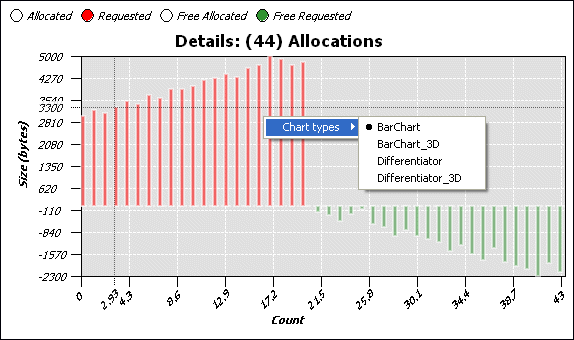
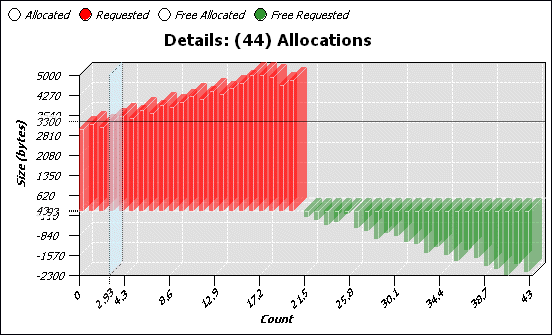
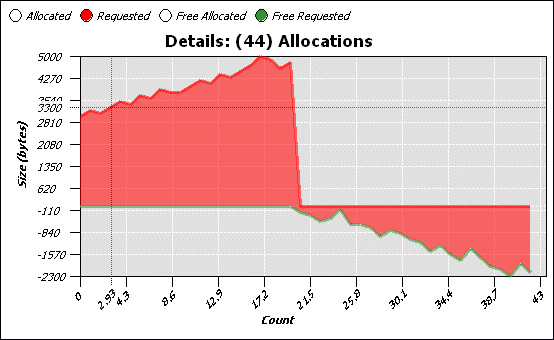
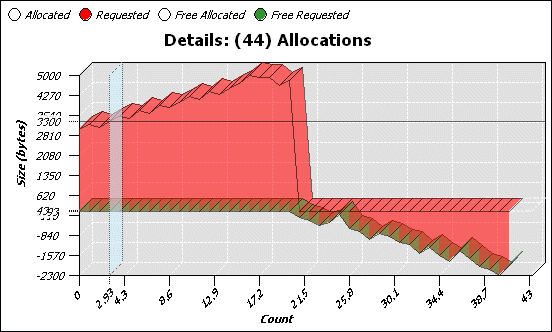
As described above, the Allocations pane shows you allocation and deallocation events over time. Select a range of events to show a chart and details for those events.
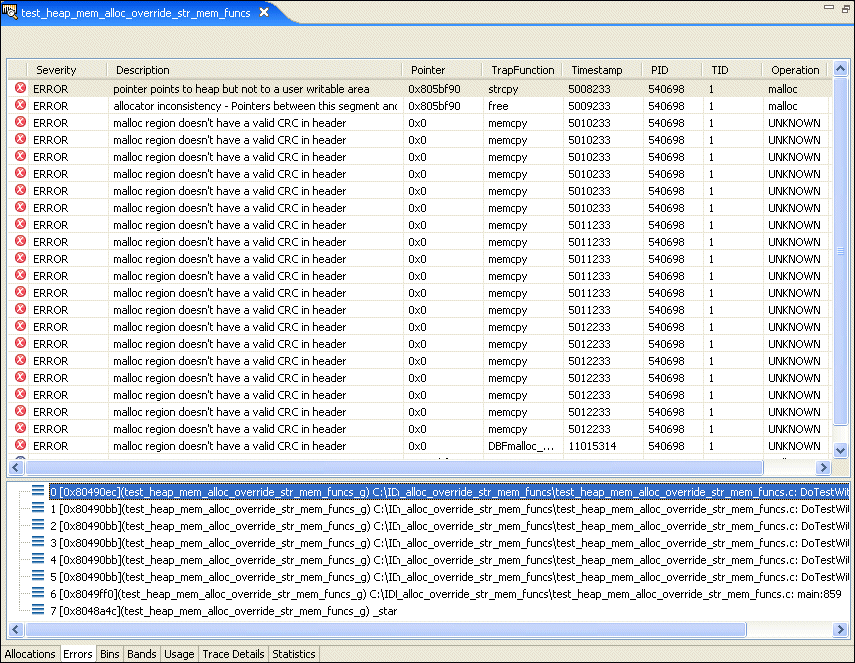
The Errors pane shows any memory errors (in red) or leaks (in blue) detected while collecting statistics. Select a line in the top pane to see a function backtrace in the lower pane.
The allocator keeps counters for allocations of various sizes to help gather statistics about how your application is using memory. Blocks up to each power of two (2, 4, 8, 16, etc. up to 4096) and “large” blocks (anything over 4 KB) are tracked by these counters.
The Bins pane shows the values for these counters over time:
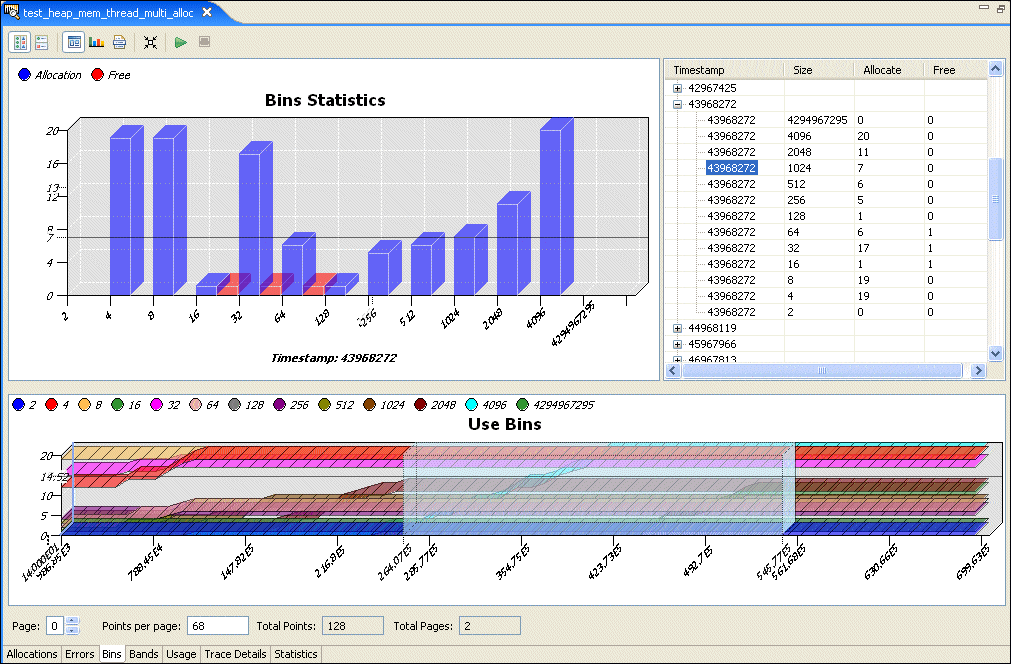
The counters are listed at the top of the Bins pane. Click the circle to the left of each counter to enable or disable the counter in the current view.
When the Bins pane is shown, the Chart pane shows allocations and deallocations for each bin at the time selected in the Detail pane. The Detail pane lists memory events for the selected region of the Bins pane.
The Bins pane includes these additional buttons:
Because of the logging that's done for each allocation and deallocation, tracing can be slow, and it may change the timing of the application. You might want to do a first pass with the bins snapshots enabled to determine the “hot spots or ranges”, and on the second pass reduce the tracing to a certain range (minimum, maximum) to filter and reduce the log set.
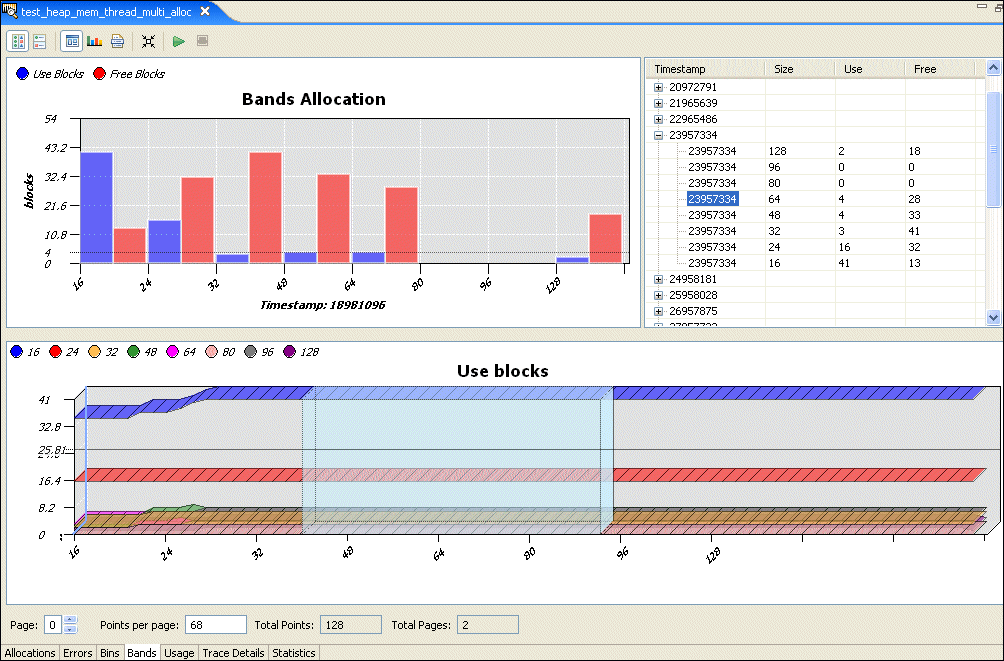
For efficiency, the QNX allocator preallocates “bands” of memory (small buffers) for satisfying requests for small allocations. This saves you a trip through the kernel's memory manager for small blocks, thus improving your performance.
The bands handle allocations of up to 16, 24, 32, 48, 64, 80, 96, and 128 bytes in size, any activity in these bands is shown on the Bands pane:
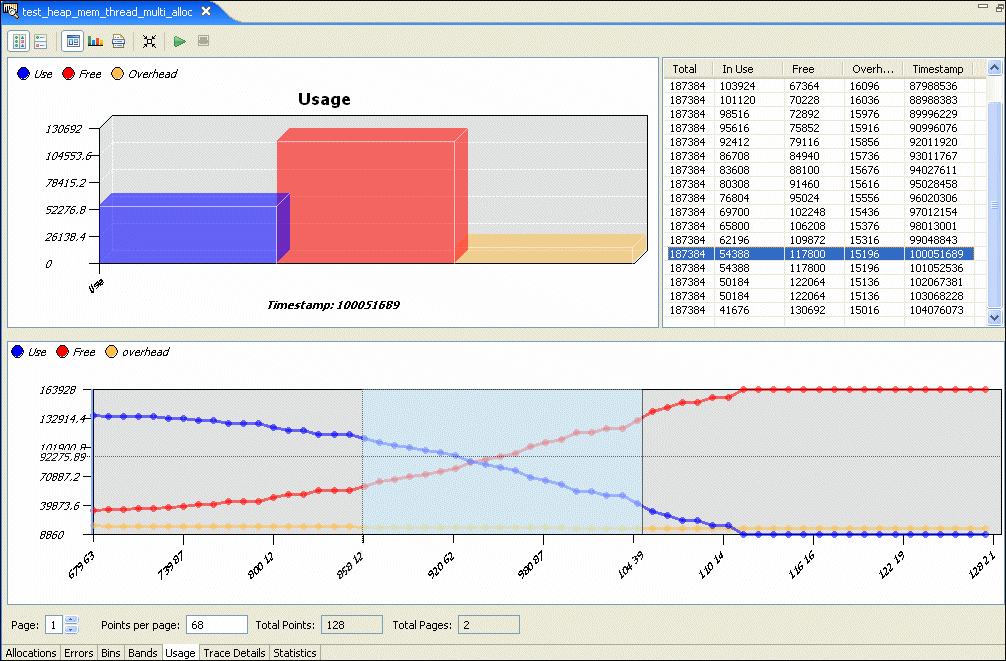
The Usage pane shows your application's overall memory usage over time.
This tab plays back the allocations, synchronized with the bins, bands, or usage, depending on what you last selected. You can use this display to look for memory leaks (e.g. bins where the number of allocations is much greater than the number of deallocations):
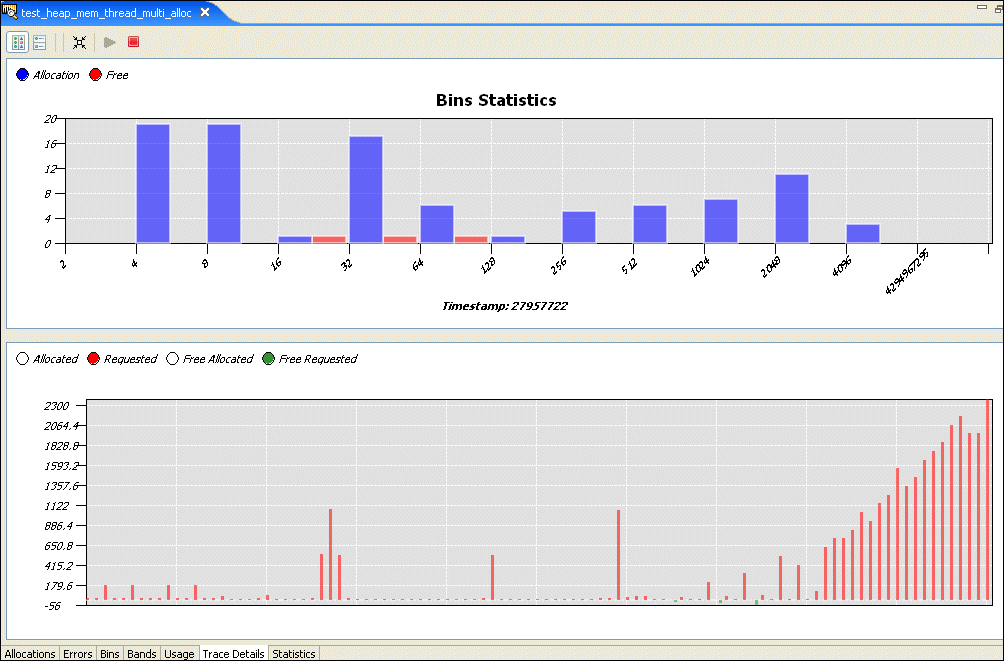
The Trace Details tab shows the trace event information (malloc() and dealloc()) for the timestamps selected in other view. You can select a region from either Bins, Bands, or Usage Tabs, right-click and then select Show in Trace Details to play back the events specified in the selection. For example, if you select Bins, the IDE would show the allocations and deallocations up to last timestamp selected. You can then click Playback to review the allocations.
In addition, you can select a region in the Trace Details tab, right-click and then select Trace Details… to return to the Allocations tab to see the selected area in the Details pane.
The Statistics pane gives you several different statistics views for the Memory Analysis session.
The Allocations pane shows the number of calls to different kinds of allocations, plus a count of each allocation for a given number of bytes:
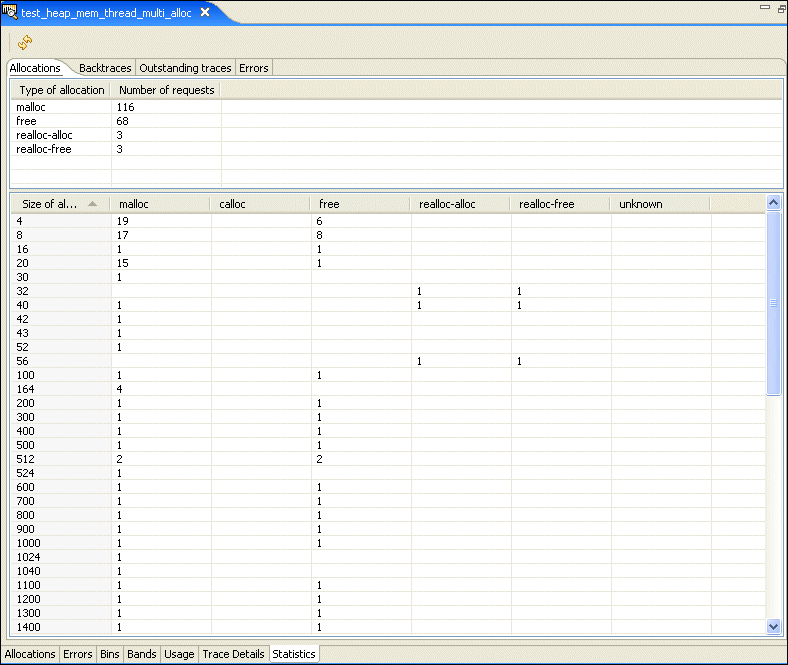
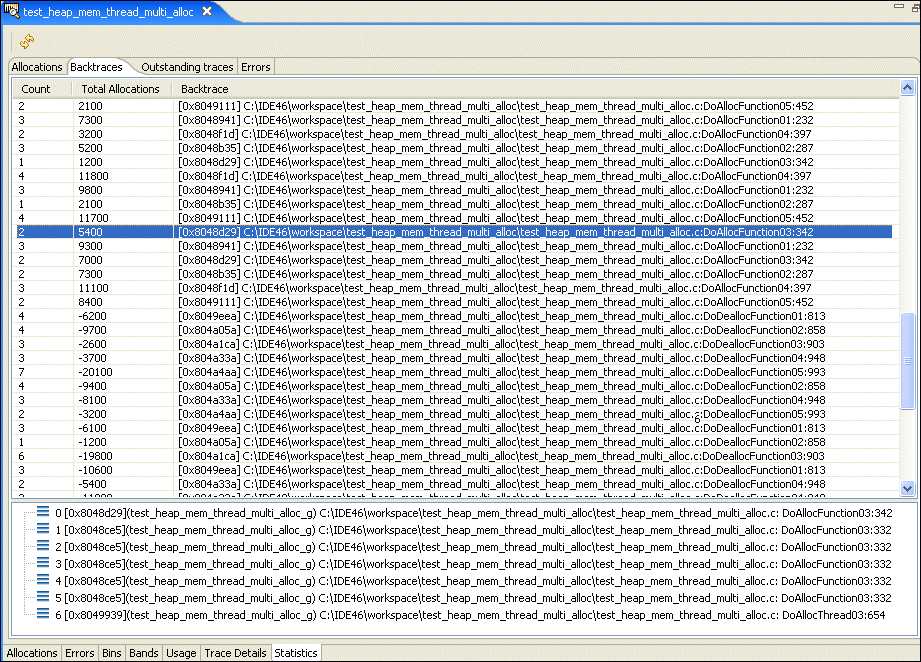
The Backtraces pane shows you a list of memory event points in your application. Select one to show a function backtrace for that event:
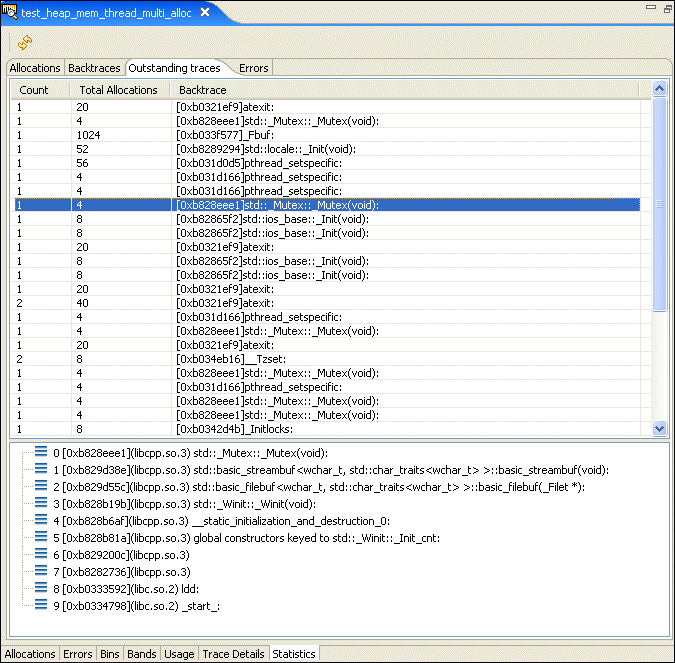
The Outstanding traces pane shows allocations that weren't deallocated when the trace ended. These aren't necessarily errors.
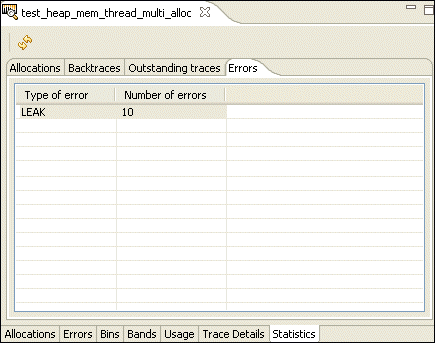
The Errors pane shows you a list of memory errors, grouped by type, that were encountered while running your application.
This tab lets you change the settings for a running process.
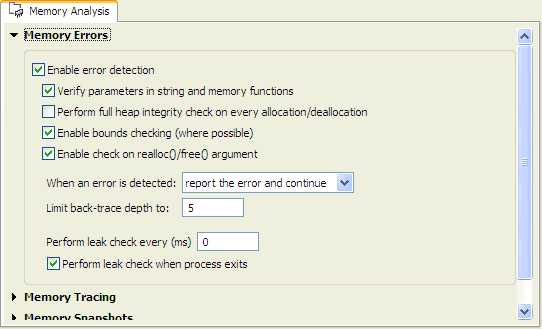
For information about these memory settings, see “Launching your program with Memory Analysis” in the Finding Memory Errors chapter.
The additional icons (from left to right) let you:
The following table shows a summary of potential error messages you might encounter during memory analysis:
| Message | Caused by | Description |
|---|---|---|
| no errors | ||
| allocator inconsistency - Malloc chain is corrupted, pointers out of order | A buffer overflow occurred in the heap. | The heap memory is corrupted. |
| allocator inconsistency - Malloc chain is corrupted, end before end pointer | A buffer overflow occurred in the heap. | The heap memory is corrupted. |
| pointer does not point to heap area | The illegal deallocation of memory. | You attempted to free non-heap memory. |
| possible overwrite - Malloc block header corrupted | A buffer overflow occurred in the heap. | The heap memory is corrupted. |
| allocator inconsistency - Pointers between this segment and adjoining segments are invalid | A buffer overflow occurred in the heap. | The heap memory is corrupted. |
| data has been written outside allocated memory block | A buffer overflow occurred in the heap. | The program attempted to write data to a region beyond allocated memory. |
| data in free'd memory block has been modified | Attempting to use memory that was previously freed. | The program is attempting to write to a memory region that was previously freed. |
| data area is not in use (can't be freed or realloced) | A buffer overflow occurred in the heap. | The heap memory is corrupted. |
| unable to get additional memory from the system | All memory resources are exhausted. | There are no more memory resources to allocate. |
| pointer points to the heap but not to a user writable area | A buffer overflow occurred in the heap. | The heap memory is corrupted. |
| allocator inconsistency - Malloc segment in free list is in-use | A buffer overflow occurred in the heap. | The heap memory is corrupted. |
| malloc region doesn't have a valid CRC in header | A buffer overflow occurred in the heap. | The heap memory is corrupted. |
| free'd pointer isn't at start of allocated memory block | An illegal deallocation of memory. | An attempt was made to deallocate the pointer that shifted from its original value when it was returned by the allocator. |
The following table shows a summary of Memory Analysis Tool (MAT) graphical user interface options (flags) and their corresponding environment variables:
| Environment variable | Where to find in Memory Analysis Tool GUI | What option to set | Additional information |
|---|---|---|---|
| LD_PRELOAD= librcheck.so | Runtime library | The newer library file is librcheck.so; the older file is libmalloc_g.so. A supported option for rcheck library. | |
| MALLOC_ACTION=<number> | When an error is detected: | Set the error action behavior to: 0 to ignore, 1 to abort, 2 to exit, 3 for core, and 4 to stop. A supported option for rcheck library. | |
| MALLOC_BTDEPTH=10 | Limit back-trace depth to: 5 | ||
| MALLOC_CKACCESS=1 | Limit back-trace depth to: | Check strings and memory functions for errors. A supported option for rcheck library. | |
| MALLOC_CKBOUNDS=1 | Enable bounds checking (where possible) | Check for out of bounds errors. A supported option for rcheck library. | |
| MALLOC_CKALLOC=1 | Enable check on realloc()/free() argument | Check alloc() and free() functions for errors. A supported option for rcheck library. | |
| MALLOC_CKCHAIN=1 | Perform a full heap integrity check on every allocation/deallocation | Check the allocator chain integrity for every allocation/deallocation. A supported option for rcheck library. | |
| MALLOC_CTHREAD=1 | Create control thread | Start a control thread. A supported option for rcheck library. | |
| MALLOC_DUMP_ LEAKS=1 | Perform leak check when process exits | Enable the dumping of leaks on exit. A supported option for rcheck library. | |
| MALLOC_ERRFILE= /dev/null | N/A | N/A | Error file location. |
| MALLOC_EVENTBTDEPTH=<number> | Limit back-trace depth to: 5 | Set the error traces depth to a specific number. A supported option for rcheck library. | |
| MALLOC_FATAL=0 | When an error is detected: report the error and continue | ||
| MALLOC_FILE=<file> | Target output file or device: | Re-direct output to a file. You can use ${pid} in the filename to replace with process Id and escape $ if running from the shell. A supported option for rcheck library. | |
| MALLOC_HANDLE_SIGNALS=0 | N/A | N/A | When the value is 0, don't install signal handlers. A supported option for the rcheck library. |
| MALLOC_START_TRACING=1 | Enable memory allocation/deallocation tracing | Enable memory tracing (0 to disable). A supported option for rcheck library. | |
| MALLOC_STAT_BINS=<bin1>,<bin2>,... | Bin counters (comma separated) e.g. 8, 16, 32, 1024 | Set custom bins. A supported option for rcheck library. | |
| MALLOC_TRACEBTDEPTH=<number> | Limit back-trace depth to: | Set the allocation traces depth to a specific number. A supported option for rcheck library. | |
| MALLOC_TRACEMAX=<number> | Maximum allocation to trace: | Only trace the allocation for the <= <number> of bytes. A supported option for rcheck library. | |
| MALLOC_TRACEMIN=<number> | Minimum allocation to trace: | Only trace the allocation for the >= <number> of bytes. A supported option for rcheck library. | |
| MALLOC_TRUNCATE=1 | N/A | N/A | Truncate the output files before writing. A supported option for rcheck library. |
| MALLOC_USE_CACHE=<number> | N/A | N/A | Set to 0 to disable optimization. The default is 32. A supported option for rcheck library. |
| MALLOC_VERBOSE=1 | Show debug output on console | When set to 1, it enables the debug output. A supported option for the rcheck library. | |
| MALLOC_WARN=0 | When an error is detected: report the error and continue |
You can perform memory analysis on a running program, or you can log the trace to a file on the target system. The advantage of logging the trace is that doing so frees up qconn resources; you run the process now, and perform the analysis later.
 |
When analyzing the data from a log file, you can't do any backtracing. |
To log the trace to a file:
A dialog appears:
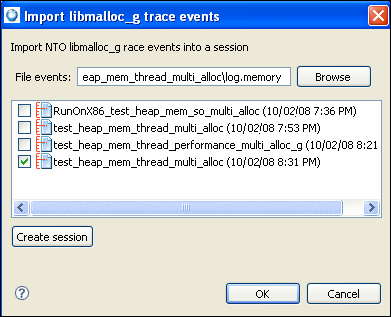
You can also run this from the command line by setting the appropriate environment variables. For example:
LD_PRELOAD=librcheck.so MALLOC_CTHREAD=1 MALLOC_FILE=/tmp/trace.rmat ./<your_binary>
LD_PRELOAD=librcheck.so MALLOC_FILE=/tmp/trace.rmat MALLOC_START_TRACING=1 ./<your_binary>
LD_PRELOAD=librcheck.so MALLOC_FILE=/tmp/trace.rmat ./<your_binary>
LD_PRELOAD=librcheck.so MALLOC_HELP=1 <your_binary>
LD_PRELOAD=librcheck.so MALLOC_TRACEBT=5 MALLOC_DUMP_LEAKS=/tmp/traces.rmat
MALLOC_TRACE=/tmp/traces.rmat MALLOC_CTHREAD=1 ALLOC_EVENTFILE=/tmp/traces.rmat <your_binary>
 |
For the supported options of the rcheck library, see the summary of Memory Analysis Tool (MAT) graphical user interface options (flags) and their corresponding environment variables at “Memory Analysis GUI flags and corresponding environment variables.” |
LD_PRELOAD=librcheck.so MALLOC_CTHREAD=1 ./my_app
As mentioned earlier, you can analyze memory events and traces for a running process. To do this, you need to create a launch profile, as follows:
After launching, a dialog appears with a list of all the running processes on the target. Choose the process you want to attach to; the Session view then lists it.
When you're done, disconnect from the process and let it continue.
To analyze shared objects, you must set up the Memory Analysis tab in your launch configuration like this:
In the Session View, you can expand your session, expand your process, and then select a shared object to view its memory events and traces in a new tab in the editor.
The QNX Memory Analysis perspective includes the following views:
To test an application for memory leaks:
In the example below, notice the steady growth in the chart. If memory usage continues to increase over time, then the process is not returning some of the allocated memory.

Since memory leaks can be apparent or hidden, to know exactly what's occurring in your application, use the Memory Analysis tool to automatically find the apparent memory leaks type. A memory leak is considered apparent when the binary address of that heap block (marked as allocated) is not stored in any of the process memory and current CPU registers any longer.
There are three ways of finding memory leaks using the QNX Memory Analysis tool:
To perform an automatic leak check, use the Perform leak check when process exits option on the Memory Analysis tab of the launch configuration. Use the Perform leak check every (ms) to specify your desired interval options. If these options are enabled, the Memory Analysis tool has automatically checks for memory leaks in the currently running program.
The following illustration shows a list of memory leaks that the memory Analysis tool identified in the example application:
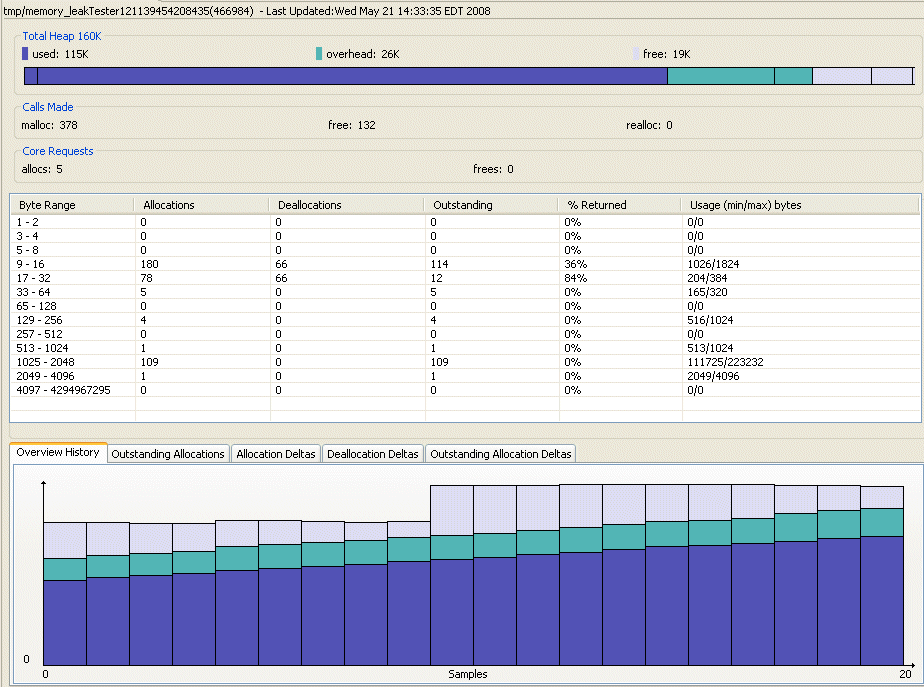
For this example, the Allocated column (which refers to the outstanding allocations in memory), shows the steady growth for its value in the chart. The Byte range from 9 - 16 increases each time the view refreshes; however the free count doesn't. In addition, the histogram chart below shows a clear indication that there's a problem. The number of malloc()s continue to steadily increase over time. This trend shows that the selected process is not returning some of the allocated memory.

To find a memory leak, click the Get Leaks button on the Settings page of the Memory Analysis Session viewer while the application runs (which can also be used by the debugger).
![]()
In a continuously running application, the following procedure enables memory leak detection at any particular point during program execution:
Before you resume the process, take note that no new data will be available in the Session Viewer because the memory analysis thread and application threads are stopped while the process is suspended by the debugger.
If leaks did not appear on the Errors tab of the Session Viewer, either there were no leaks, or the time given to the control thread (a special memory analysis thread that processes dynamic requests) to collect the leaks was not long enough to perform the command; and was suspended before the operation completed.
 |
Besides apparent memory leaks, an application can have other types of leaks that the memory Analysis tool cannot detect. These leaks include objects with cyclic references, accidental point matches, and left-over heap references (which can be converted to apparent leaks by nullifying objects that refer to the heap). If you continue to see the heap grow after eliminating apparent leaks, you should manually inspect some of the allocations. You can do this after the program terminates (completes), or you can stop the program and inspect the current heap state at any time using the debugger. |
In the previous section, we explained tool-assisted techniques for optimizing heap memory, and now we will describe some tips for optimizing static and stack memory:
In embedded systems, it is particularly important to optimize the size of a binary, not only because it takes RAM memory, but also because it uses expensive flash memory. Below are some tips you can use to optimize the size of an executable:
 |
There is no guarantee that code would be smaller; it can actually be larger in some cases. |
In some cases, it is worth the effort to optimize the stack, particularly when the application has some frequent picks of stack activity (meaning that a huge stack segment would be constantly mapped to physical memory). You can watch the Memory Information view for stack allocation and inspect code that uses the stack heavily. This usually occurs in two cases: recursive calls (which should be avoided in embedded systems), and heavy usage of local variables (keeping arrays on the stack).
 |
Tasks such as finding unused objects, structures that are not optimal, and code clones, are not automated in the QNX Momentics IDE. You can search for static analysis tools with given keywords to find an appropriate tool for this task. |
You can use the following techniques to optimize memory usage:
Another optimization technique is to shorten the life cycle of the heap object. This technique lets the allocator reclaim memory faster, and allows it to be immediately used for new heap objects, which, over time, reduces the maximum amount of memory required.
Always attempt to free objects in the same function as they are allocated, unless it is an allocation function. An allocation function is a function that returns or stores a heap object to be used after this function exits. A good pattern of local memory allocation will look like this:
p=(type *)malloc(sizeof(type));
do_something(p);
free(p);
p=NULL;
do_something_else();
After the pointer us used, it is freed, then nullified. The memory is then free to be used by other processes. In addition, try to avoid creating aliases for heap variables because it usually makes code less readable, more error prone, and difficult to analyze.
Another large source of memory usage occurs from the following types of allocation overhead:
User overhead usually comes from predictive allocations (usually by realloc()), which allocate more memory than required. You can either tune it by estimating the average data size, or - if your data model allows it - after the growth of data stops, you can truncate the memory to fit into the actual size of the object.
To estimate the average allocation size for a particular function call, find the backtrace of a call on the Backtraces tab on the Statistics page of the Session Viewer. The Count column represents the number of allocations for a particular stack trace, and the Total Allocated column shows the total size of the allocated memory. To calculate an average, divide the Total Allocated value by the Count value.
Padding overhead affects the struct type on processors with alignment restrictions. The fields in a structure are arranged in a way that the sizeof of a structure is larger than the sum of the sizeof of all of its fields. You can save some space by re-arranging the fields of the structure. Usually, it is better to group fields of the same type together. You can measure the result by writing a sizeof test. Typically, it is worth performing this task if the resulting sizeof matches with the allocator block size (see below).
Heap fragmentation occurs when a process uses a lot of heap allocation and deallocation of different sizes. When this occurs, the allocator divides large blocks of memory into smaller ones, which later can't be used for larger blocks because the address space isn't contiguous. In this case, the process will allocate another physical page even if it looks like it has enough free memory. The QNX memory allocator is a “bands” allocator, which already solves most of this problem by allocating blocks of memory of constant sizes of 16, 24, 32, 48, 64, 80, 96 and 128 bytes. Having only a limited number of possible sizes lets the allocator choose the free block faster, and keeps the fragmentation to a minimum. If a block is more that 128 bytes, it's allocated in a general heap list, which means a slower allocation and more fragmentation. You can inspect the heap fragmentation by reviewing the Bins or Bands graphs. An indication of an unhealthy fragmentation occurs when there is growth of free blocks of a smaller size over a period of time.
Block overhead is a side effect of combating heap fragmentation. Block overhead occurs when there is extra space in the heap block; it is the difference between the user requested allocation size and actual block size. You can inspect Block overhead using the Memory Analysis tool:
In the allocation table, you can see the size of the requested block (11) and the actual size allocated (16). You can also estimate the overall impact of the block overhead by switching to the Usage page:
You can see in this example that current overhead is larger than the actual memory currently in use. Some techniques to avoid block overhead are:
You should consider allocator band numbers, when choosing allocation size, particularly for predictive realloc(). This is the algorithm that can provide you with the next highest power or two for a given number m if it is less than 128, or a 128 divider if it is more than 128:
int n;
if (m > 256) {
n = ((m + 127) >> 7) << 7;
} else {
n = m - 1;
n = n | (n >> 1);
n = n | (n >> 2);
n = n | (n >> 4);
n = n + 1;
}
It will generate the following size sequence: 1,2,4,8,16,32,64,128,256,384,512,640, and so on.
You can attempt to optimize data structures to align with values of the allocator blocks (unless they are in an array). For example, if you have a linked list in memory, and a data structure does not fit within 128 bytes, you should consider dividing it into smaller chunks (which may require an additional allocation call), but it will improve both performance (since band allocation is generally faster), and memory usage (since there is no need to worry about fragmentation). You can run the program with the Memory Analysis tool enabled once again (using the same options), and compare the Usage chart to see if you've achieved the desired results. You can observe how memory objects were distributed per block range using Bands page:
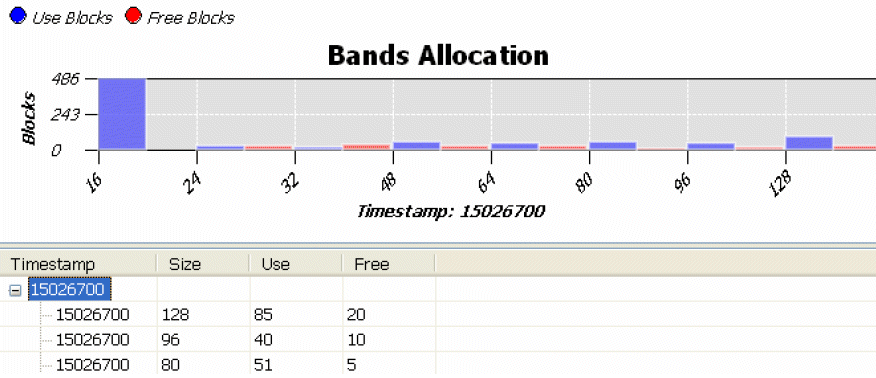
This chart shows, for example, that at the end there were 85 used blocks of 128 bytes in a block list. You also can see the number of free blocks by selecting a time range.
When you free memory using the free() function, memory is returned to the process pool, but it does not mean that the process will free it. When the process allocates pages of physical memory, they are almost never returned. However, a page can be deallocated when the ratio of used pages reaches the low water mark. Even in this case, a virtual page can be freed only if it consists entirely of free blocks.
After you have prepared a memory analysis (profiling) session, double-click on a session to open the Memory Analysis Session viewer. The Allocations page shows the Overview: Requested Allocations chart. For example, let's take a closer look at this chart.
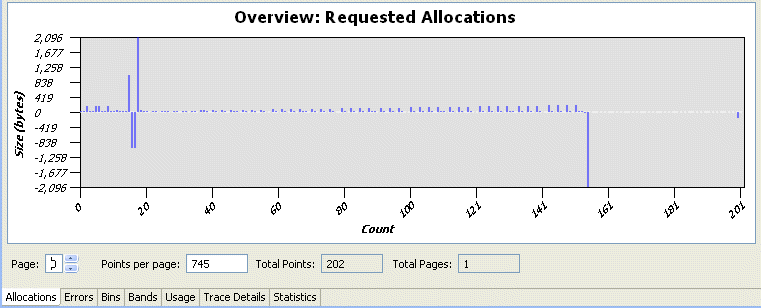
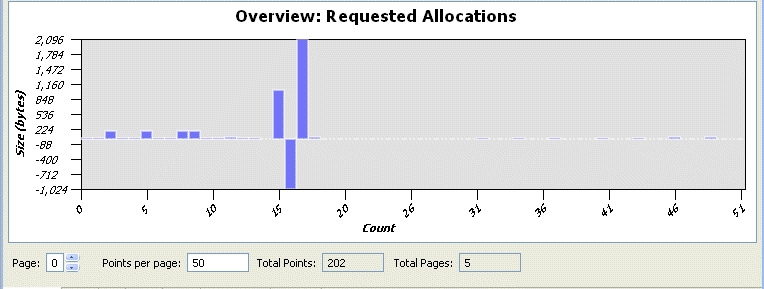
This example chart shows memory allocation and deallocation events that are generated by the malloc() and free() functions and their derivatives. The X-axis represents the event number (which can change to a timestamp), and the Y-axis represents the size (in bytes) of the allocation (if a positive value), or the deallocation (if a negative value).
Let's take a closer look at the bottom portion of the chart. The Page field shows the scrollable page number, the Total Points field shows how many recorded events there are, the Points per page field shows how many events can fit onto this page, and the Total Pages field shows how many chart pages there are in total.
For this example, there are 202 events that fit within the chart; however for some larger charts, all of them would not likely fit on this single chart. If that were the case, there are several choices available. First, you can attempt to reduce the value in the Points per page field to 50, for example.
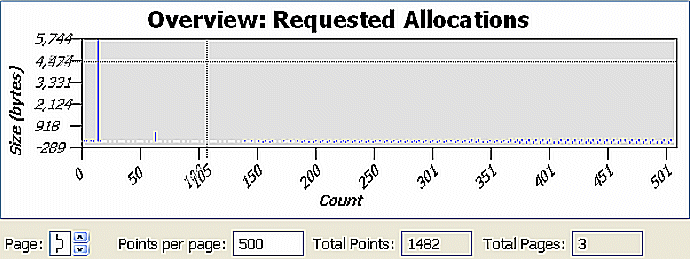
However, in the case where the number of events is large (the X-axis value is a large number, 1482 events), changing the value of Points per page field might not significantly improve the visual appearance of the data in the chart. For this example, there are 1482 events, and all of these events don't fit on a single chart:
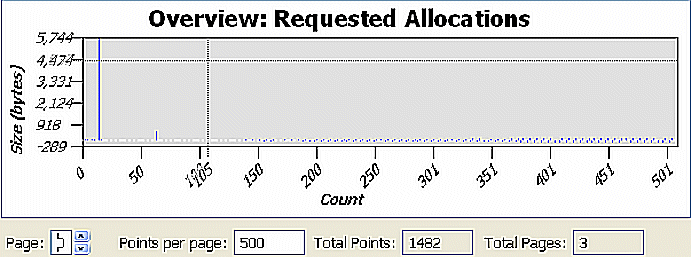
If you reduce the value in the Points per page field to 500, the graphical representation in the following illustration is better; however, it's still not very useful.
Alternatively, you can use filters to exclude data from the chart. If you look at the Y-axis of the following chart, notice some large allocations at the beginning. To see this area more closely, select this region with the mouse. The chart and table at the top change to populate with the data from the selected region.
Now, locate the large allocation and check its stack trace. Notice that this allocation belongs to the function called monstartup(), which isn't part of the user defined code; meaning that it can't be optimized, and it can probably be excluded from the events of interest.
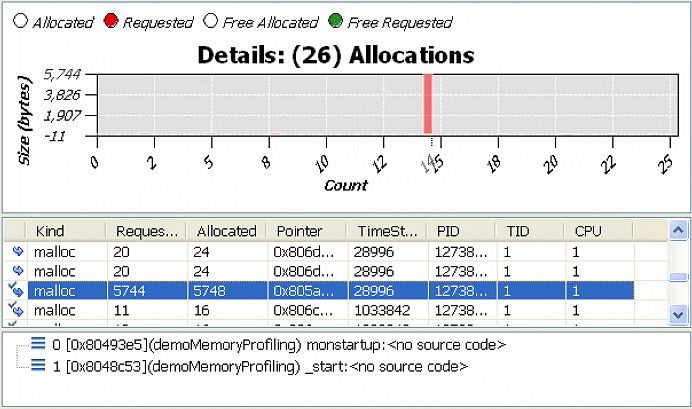
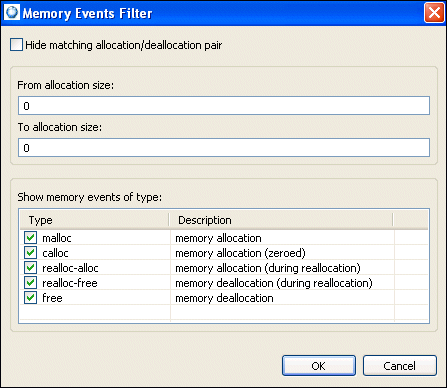
You can use a filter to exclude this function. Right-click on the Overview chart's canvas area and select Filters... from the menu. Type 1000 in the To allocation size field. The overview will look like this:

From the filtered view, there is a pattern: the allocation is followed by a deallocation, and the size of the allocations grows over time. Typically, this growth is the result of the realloc() pattern. To confirm the speculation, return to the Filters... menu option, and disable (un-check) all of the allocation functions, except for the realloc-alloc option. Notice that the growth occurs with a very small increment.

Next, select a region of the Overview chart and explore the event table. Notice the events with the same stack trace; this is an example of a realloc() call with a bad (too small) increment (the pattern for a shortsighted realloc()).
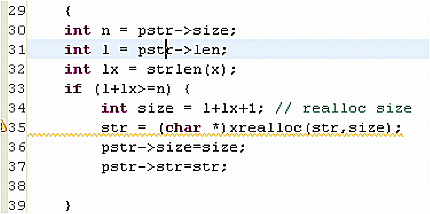
Notice that the string in the example was re-allocated approximately 400 times (from 11 bytes to 889 bytes). Based on that information, you can optimize this particular call (for performance) by either adding some constant overhead to each realloc() call, or by double allocating the size. In this particular example, if you double allocate the size, re-compile and re-run the application, and then open the editor and filter all but the realloc() events, you'll obtain the following:

The figure above shows only 12 realloc() events instead of the original 400. This would significantly improve the performance; however, the maximum allocated size is 1452 bytes (600 bytes in excess of what is required). You can adjust the realloc() code to better tune it for a typical application run. Normally, you should make realloc() sizes similar to the allocator block sizes.
To check other events, in the Filters menu, enable all functions, except for realloc(). Select a region in the overview:

In the Details chart, the alloc/free events have the same size. This is the typical pattern for a short-lived object.
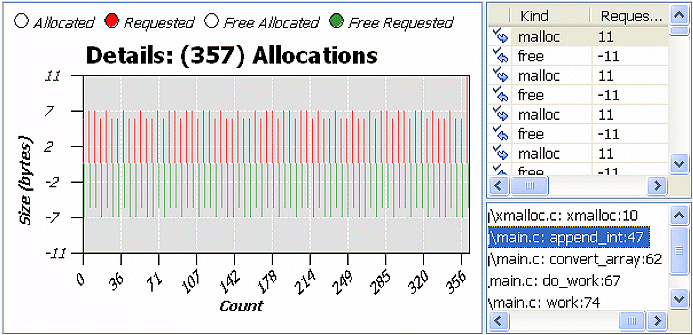
To navigate to the source code from the stack trace view, double-click on a row for the stack trace.
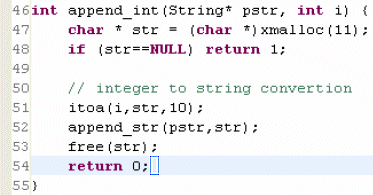
This code has an object that allocates 11 bytes, and then it is freed at the end of the function. This is a good candidate to put a value on the stack. However, if the object has a variable size, and originates from the user, using stack buffers should be done carefully. As a compromise between performance and security, you can perform a size verification, and if the length of the object is less than the buffer size, it is safe to use the stack buffer; otherwise, if it is more than the buffer size, the heap can be allocated. The buffer size can be chosen based on the average size of allocated objects for this particular stack trace.
Shortsighted realloc() functions and short-lived objects are memory allocation patterns which can improve performance of the application, but not the memory usage.
Occasionally, application driven data structures have a specific size, and memory usage can be greatly improved by customizing block sizes. In this case, you either have to write your own allocator, or contact QNX to obtain a customizable memory allocator.
Use the Bin page to estimate the benefits of a custom block size. First, enter the bin size in the Launch Configuration of the Memory Analysis tool, run the application, and then open the Bins page to explore the results. The resulting graph shows the distribution of the heap object per imaginary blocks, based on the sizes that you selected.
It is important for you to know when and where memory is being consumed within an application. The Memory Analysis tool includes several views that use the trace data from the Memory Analysis session to help extract and visually show this information to determine memory usage (allocation and deallocation metrics). Showing this information using various charts helps you observe the changes in memory usage
The IDE includes the following tabs to help you observe changes in memory over time:
To access these tabs:
 |
To begin to view data on your graphs, you need to set logging for the target, and you need to select an initial process from the Target Navigator view. |
These charts show the memory usage and the volume of memory events over time (the allocation and deallocation of memory). These views reflect the current state of the active editor and active editor pane. You can select an area of interest in any of the charts; then, using the right-click menu, zoom in to show only that range of events to quickly isolate areas of interest due to abnormal system activity.
 |
The vertical scale always changes to reflect the maximum range of data currently being shown. To lock the current view of the data on the graph so that you can see the results without constant change, click the Lock icon ( Depending on the time interval you specify, an indicator on the lines of the graphs is used to mark the time measurement intervals. However, if you select a different process for a period of time and then return, or if there is no change in the data for the selected process, these indicator marks aren't shown on the graph line for the specified period where there is no activity. To identify where no deltas in memory have occurred (for whatever reason), the line changes to a solid line. For the first three byte ranges (1-2, 3-4, and 5-8) the values are zero because the allocator starts at byte 16 (byte range 9-16). |
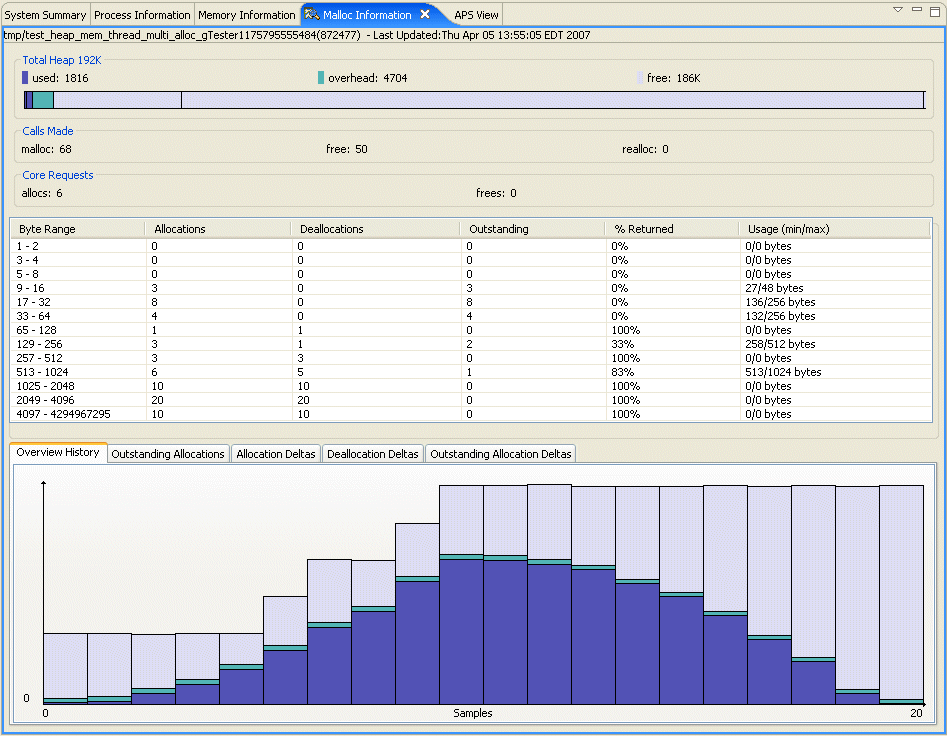
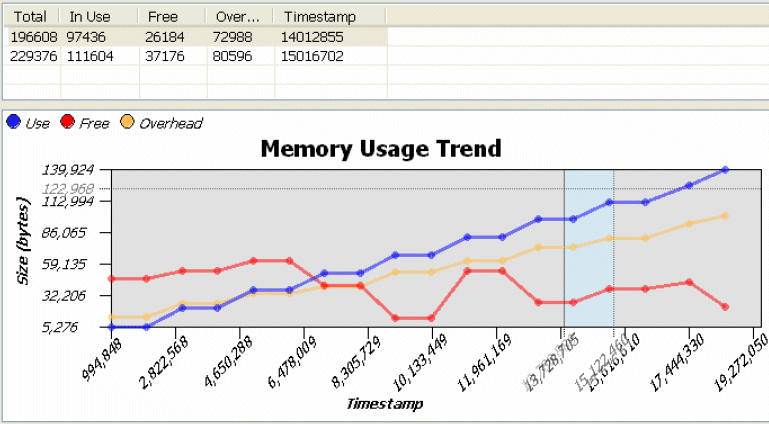
This graph shows the total allocation of memory within your program over time for the selected process.
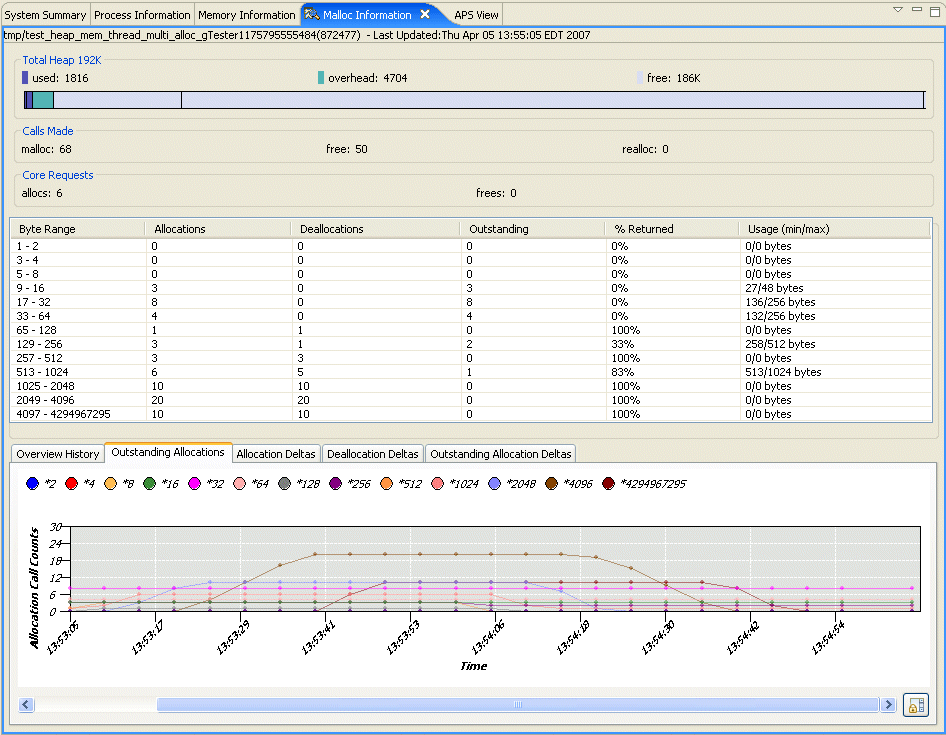
If you compare it to the Overview History tab, you can see the trend of how memory is being allocated within your program.
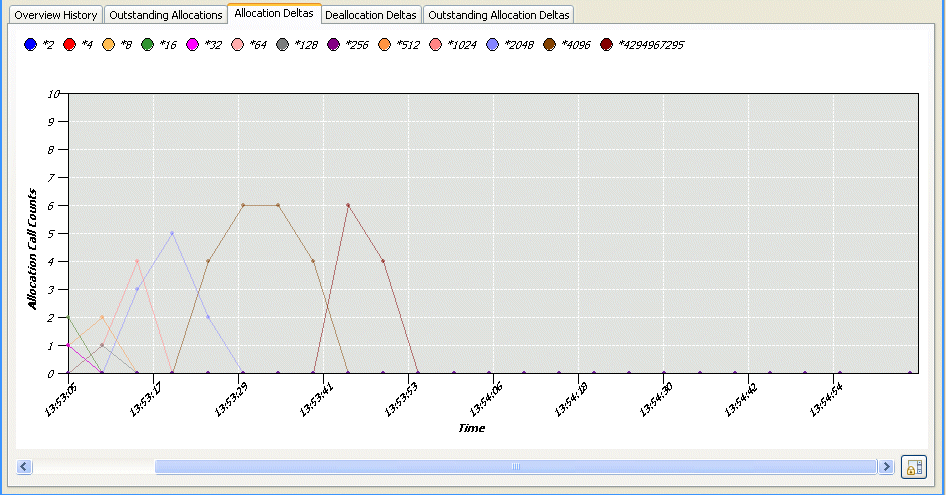
This graph shows the changes to the allocation of memory within your program over time for the selected process. From this type of graph, you can observe which band(s) has the most activity.
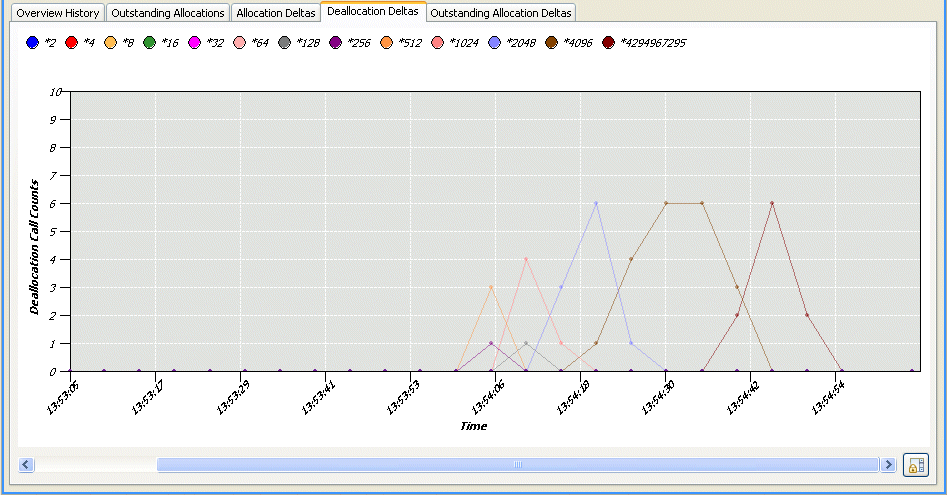
This graph shows the changes to the deallocation of memory within your program over time for the selected process from the Target Navigator view. From this type of graph, you can observe which band(s) has the least activity.
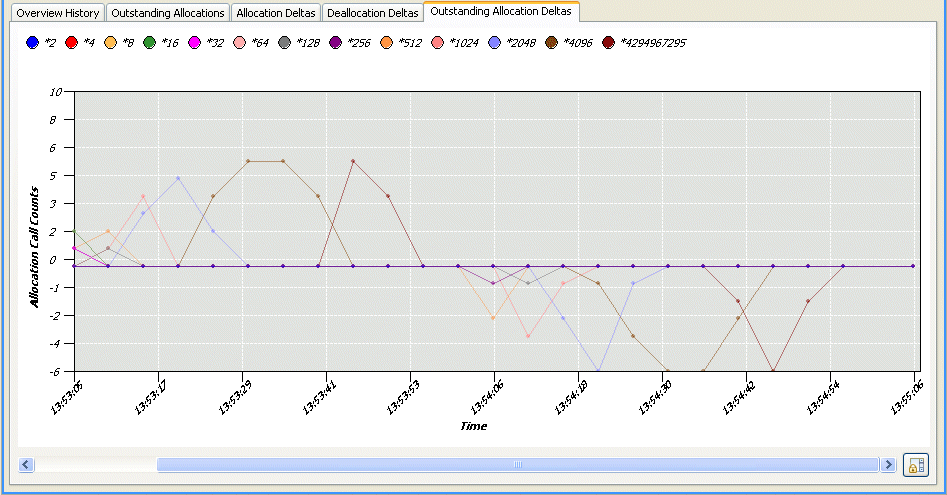
This graph shows the differences between the memory that was allocated and deallocated for the selected process; it shows a summary of the free memory. From this graph, you can observe which band(s) might be leaking memory, and by how much.
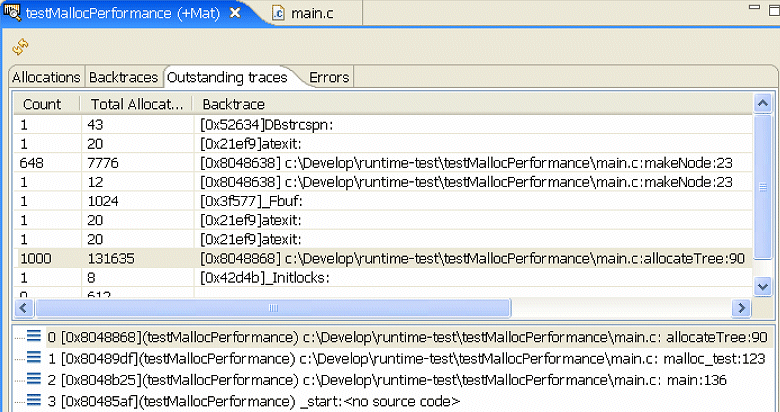
To manually inspect outstanding allocations:
The Details view and table become populated with the data.

The same data that is grouped by backtraces is available from the Statistics page on the Outstanding traces tab.
Alternatively, you can inspect memory allocations that occurred during a particular time frame of interest by opening the Usage page, which will be populated with snapshots of memory usage (if you enabled this option).
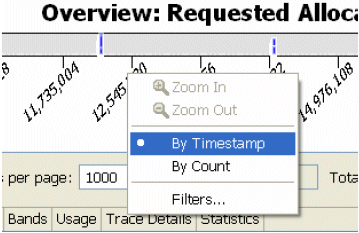
You will notice the allocations and deallocations that occurred during this period in the Details chart and event table. Review the event table results.
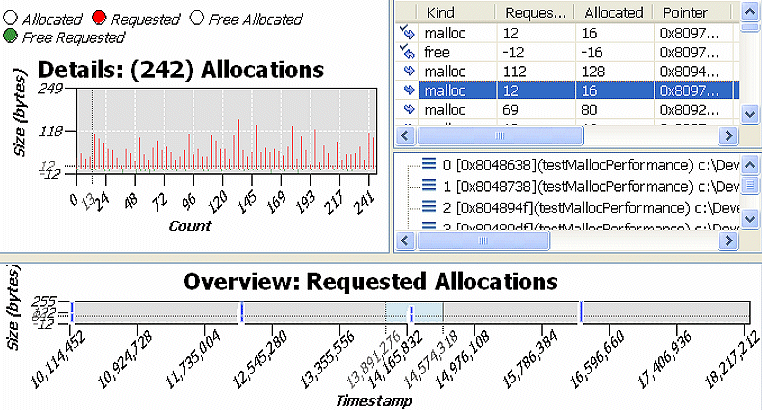
All malloc() calls that do not have a paired free() would have the following icon in the left column that doesn't have a checkmark beside it:
![]()
The Memory Analysis Tool can import and export trace data from a Memory Analysis session view. With the Memory Analysis Tool, you can:
In the IDE, you can export your trace data session information from a Memory Analysis session view. When exporting memory analysis information, the IDE lets you export the event-specific results in .csv format, and the other session trace data in .xml format. Later, you can import the event-specific results into a spreadsheet, or you can choose to import the other session trace data into a Memory Analysis session view to review the results.
 |
For the IDE to begin to trace and collect memory analysis session information, the Memory Analysis tool must be enabled. To enable the Memory Analysis tool:
|
To export a memory analysis data file:
The list shows all of the memory analysis trace data that you accumulated for the current view.
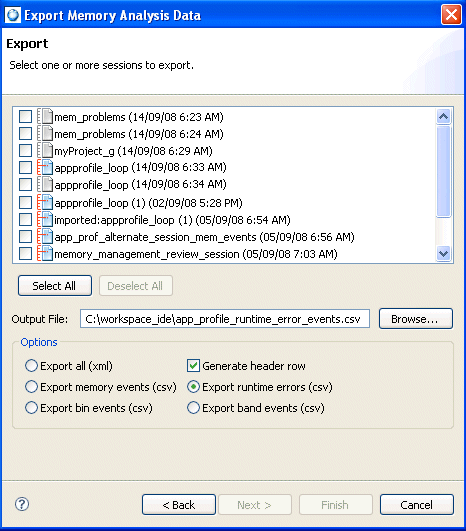
Memory events — the export file for memory events contains information about the allocation and deallocation of events over time. For descriptions of the format of the exported data for memory events, see “Memory event results format.”
Bin events — the export file for bin events contains information from the allocator. This allocator maintains counters to help gather statistics about how your application uses memory. The allocator keeps track of blocks of memory by powers of two (2, 4, 8, 16, and so on, up to 4096), including larger blocks (anything over 4 KB). In the Memory Analysis Tool, the Bins pane shows a graphical representation of the values for these counters over time. For descriptions of the format of the exported data for bin events, see “Bin event results format.”
Runtime errors — the export file for runtime errors contains information that shows memory errors or leaks detected while the Memory Analysis Tool collected statistics during the session. For descriptions of the format of the exported data for runtime events, see “Runtime error event results format.”
Band events — the export file for band events contains information about the use of bands to minimize the kernel's memory manager for small blocks. The QNX allocator preallocates small buffers of memory for satisfying requests for small allocations, thereby improving your performance. These bands can handle allocations of up to 16, 24, 32, 48, 64, 80, 96, and 128 bytes in size. In the Memory Analysis Tool, the Bands pane shows a graphical representation for the activity in these bands. For descriptions of the format of the exported data for bin events, see “Band event results format.”
 |
If you select an output file that currently exists, you're prompted during the export process to click Yes to overwrite this file. |
The resulting output file contains all of the memory analysis data for the selected session(s), based on your selected options.
 |
When you export session information and then import it into a Memory Analysis session view to review the results, the session is the same; however, the name, date, and some other properties that are unique to a session will be different. |
When the IDE exports the event data in CSV format, the resulting data for the exported file contains different information depending on the type of event selected for export. The types of event formats you can expect in an exported CSV file are:
 |
To include column headers for the event data in the exported CSV file, select the Generate header row checkbox in the Exporting Memory Analysis Data wizard. |
For a memory event (allocation/deallocation events), the data in the results file appears in the following order:
For a bin event, the data in the results file appears in the following order:
For a runtime error event, the data in the results file appears in the following order:
For a band event, the data in the results file appears in the following order:
In the IDE, you can import trace data session information from a Memory Analysis session view. When importing memory analysis session information, the IDE lets you import the event-specific results for libmalloc events in .csv format, and the other session trace data in .xml format.
To import data from an XML file:
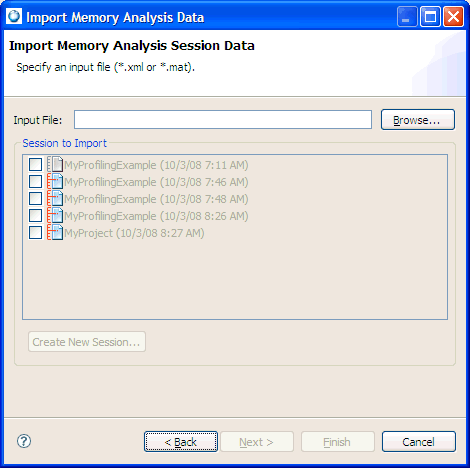
To import data from an XML file:
 |
You don't need to select any sessions from the list because they were automatically created (using the same names) when they were exported with the prefix “imported:”. |
 |
When the import process completes, you can open a Memory Analysis session and view the results. After importing, you can rename the session by right-clicking in the session and selecting Rename. |
 |
If it isn't possible to start a Memory Analysis session using the IDE, for example when there is no network connection between target and host machines, or qconn is not running on target machine, you can import memory analysis trace data for libmalloc events. |
To import memory analysis trace data for libmalloc events:
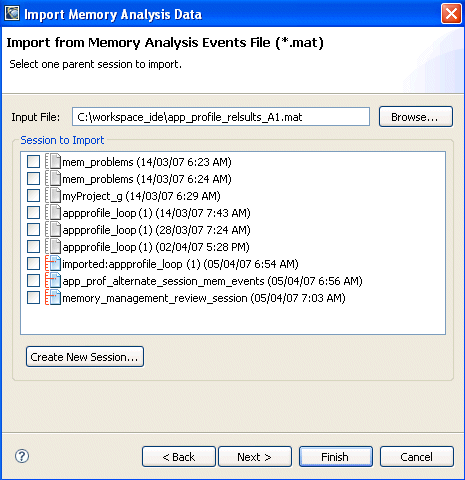
For information about exporting session information to create an events file, see “Exporting memory analysis data.”
You can select only one session for the import process.
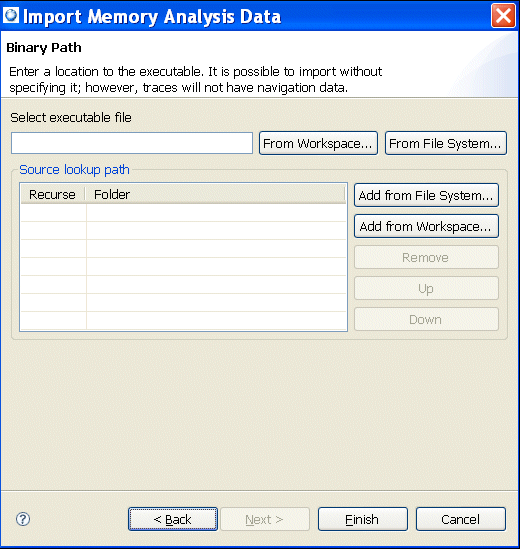
Although this step is optional, you should select a binary and source search folder for the application; otherwise, reported events will not have a connection to the source code, and traces will not have navigation data.
The executable you select should be exactly the same as the one running on the target machine.
When the importing process completes, you can open the Memory Analysis session to view the results.
![[Previous]](prev.gif) |
![[Contents]](contents.gif) |
![[Index]](keyword_index.gif) |
![[Next]](next.gif) |